Recipe
Cross-species label transfer with bio foundation models
Most cell atlases are human or mouse. For other species, such as macaque or mouse lemur, cell types are often annotated by hand, or not at all. If a model places matching cells from different species close together, you can train a classifier on human cells and use it to annotate another primate.
Bio foundation models are trained on millions of cells, mostly from human and mouse. Comparing several of them on your own data means getting each model's weights, a GPU and the preprocessing each one expects. The Helical MCP handles that part: one prompt runs every hosted model on the same dataset.
In this cookbook, you embed a balanced four-species atlas (human, macaque, mouse and mouse lemur; 10,000 cells across eight tissues) with all 15 single-cell models on the platform. You compare them with scIB, then use the top-scoring model to transfer human cell-type labels to macaque and mouse lemur.
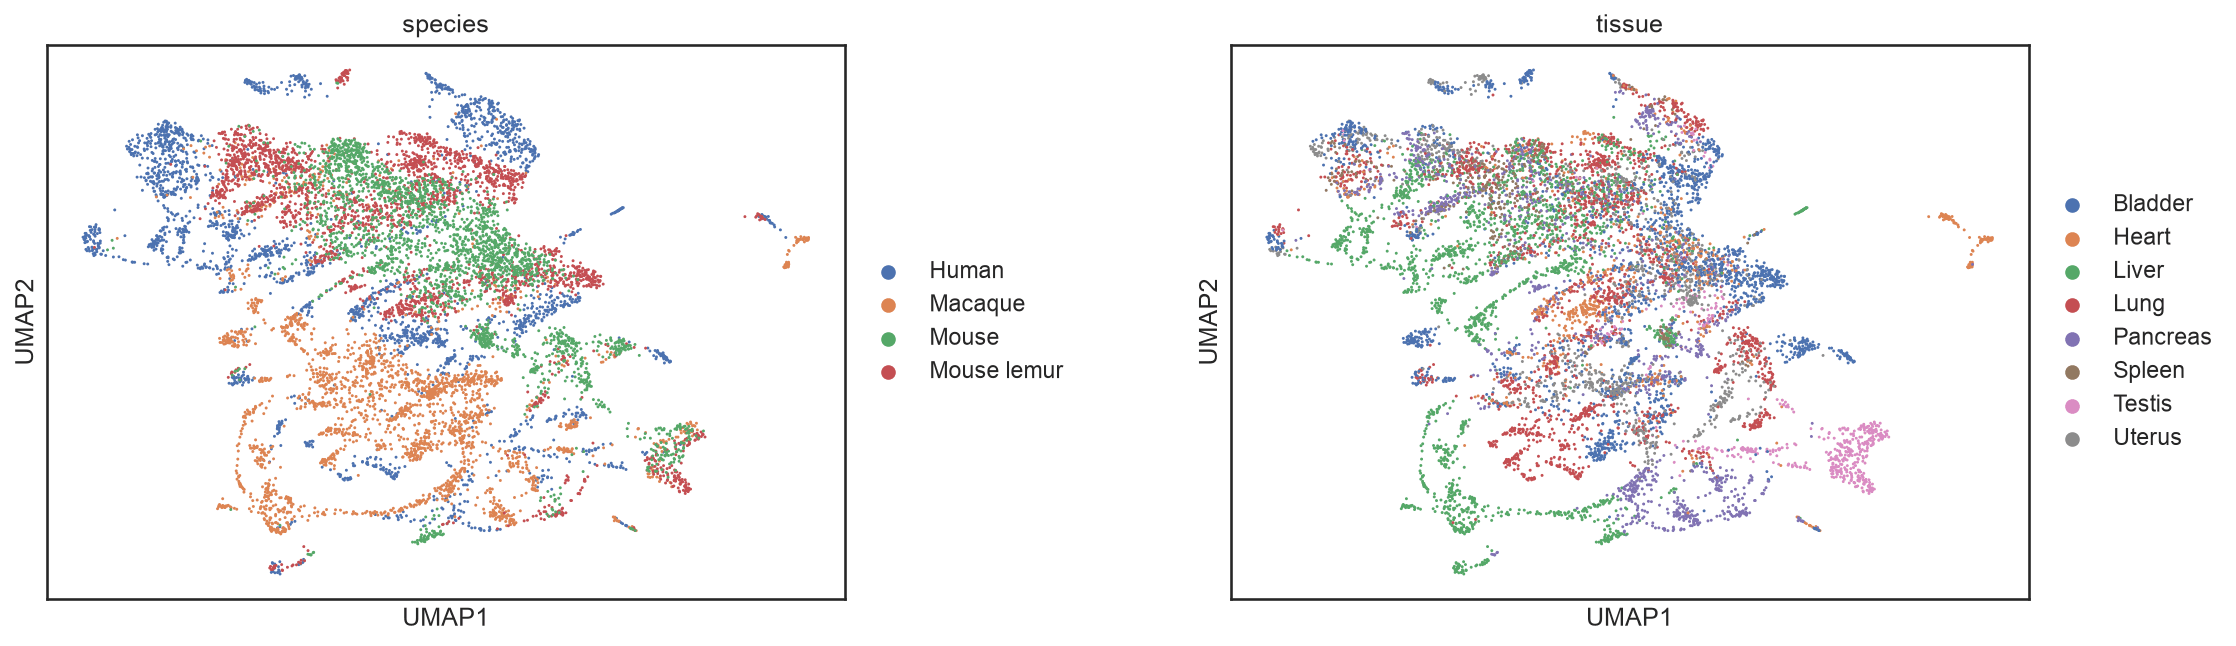
- Build a cohort with the same tissues in every species, on a shared ortholog gene space.
- Register it and embed it with every hosted model.
- Compare the models with scIB, against a PCA baseline.
- Train a classifier on human cells and score its predictions on macaque and mouse lemur.
- Compare ground truth and predictions on the same UMAP.
You need the Helical MCP connected (see Getting started) and about 5 credits.
1Load the experiment
- Download the curated cohort into
data/. The embeddings come from the prompts in step 3; running this notebook doesn't start any runs.
aws s3 cp s3://helicalpackage/cookbooks/cross-species-demo/cross_species_balanced_10000.h5ad data/ --no-sign-request
- Keep the embeddings together with their input and cell order: a vector without its cell order can't be reused.
from pathlib import Path
import importlib.metadata
import json
import sys

import anndata as ad
import numpy as np
import pandas as pd
import scanpy as sc
import matplotlib.pyplot as plt
import seaborn as sns
from IPython.display import display, Markdown
from IPython import get_ipython

get_ipython().run_line_magic('matplotlib', 'inline')

DATA_DIR = Path('data')
INPUT = DATA_DIR / 'cross_species_balanced_10000.h5ad'
EMBEDDINGS = DATA_DIR / 'embeddings'
OUTPUT = Path('results')
FIGURES = OUTPUT / 'figures'
FIGURES.mkdir(parents=True, exist_ok=True)
SEED = 42
PRIMATES = ['Macaque', 'Mouse lemur']
pd.set_option('display.max_colwidth', 90)
sns.set_theme(style='white', context='notebook')

data = ad.read_h5ad(INPUT)
assert data.obs_names.is_unique, 'Repeated cell IDs invalidate alignment.'
print('Execution environment:', sys.version.split()[0])
print({package: importlib.metadata.version(package)
       for package in ['anndata', 'scanpy', 'numpy', 'pandas', 'scikit-learn', 'scib-metrics']})
Execution environment: 3.14.8
{'anndata': '0.13.4', 'scanpy': '1.12.4', 'numpy': '2.5.3', 'pandas': '3.0.6', 'scikit-learn': '1.9.1', 'scib-metrics': '0.6.1'}2Build a comparable cohort
-
The file you downloaded in step 1 is the result of this step.
-
Start from an ortholog-mapped multi-species atlas, and add mouse lemur data.
-
Keep four species: human, macaque, mouse and mouse lemur. Rat is left out because keeping it reduces the tissues shared by every species to liver alone.
-
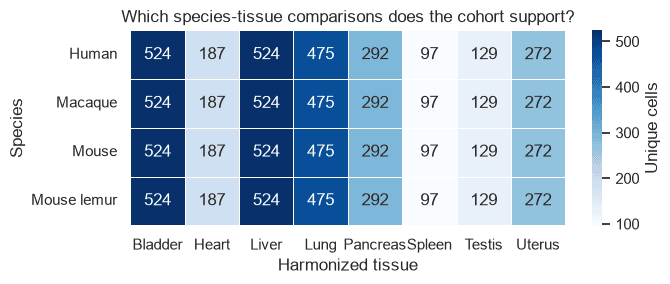
Harmonise tissue names, and keep only tissues present in every species. Eight tissues remain.
-
Give every species the same number of cells per tissue, from 97 in spleen to 524 in bladder and liver. Sample without replacement.
-
Keep the original annotations next to the harmonised ones. All species share one ortholog gene space.
Example prompt:
Build a cross-species cohort from the ortholog atlas and the mouse lemur data: human, macaque, mouse and mouse lemur. Harmonise tissue names, keep only tissues present in every species, and give every species the same number of cells per tissue, sampling without replacement. Keep the original annotations, and write the result to data/cross_species_balanced_10000.h5ad.
display(Markdown(f"**Curation:** {data.uns['curation_description']}"))
display(pd.crosstab(data.obs['source_dataset'], data.obs['species']))
<IPython.core.display.Markdown object>
species            Human  Macaque  Mouse  Mouse lemur
source_dataset
monkey_atlas           0      251      0            0
mouse_atlas            0        0   2500            0
nhpca                  0     2249      0            0
tabula_microcebus      0        0      0         2500
tabula_sapiens      2500        0      0            0
balance = pd.crosstab(data.obs['species'], data.obs['tissue'])
display(Markdown(f'**Cohort:** {data.n_obs:,} cells × {data.n_vars:,} common features; '
                 f'{len(balance)} species and {len(balance.columns)} tissues.'))
print('Every tissue present in every species:', bool((balance > 0).all().all()))
print('Identical per-tissue counts across species:', bool(balance.nunique(axis=0).eq(1).all()))
print('Smallest/largest species-tissue groups:', int(balance.min().min()), int(balance.max().max()))
fig, ax = plt.subplots(figsize=(max(7, len(balance.columns) * 0.7), max(3, len(balance) * 0.55)))
sns.heatmap(balance, annot=True, fmt='d', cmap='Blues', linewidths=0.5,
            cbar_kws={'label': 'Unique cells'}, ax=ax)
ax.set(title='Which species-tissue comparisons does the cohort support?', xlabel='Harmonized tissue', ylabel='Species')
plt.tight_layout()
plt.show()
<IPython.core.display.Markdown object>
Every tissue present in every species: True
Identical per-tissue counts across species: True
Smallest/largest species-tissue groups: 97 524
3Register the cohort and embed it with every model
Example prompt:
Register data/cross_species_balanced_10000.h5ad with Helical. Keep the original cell order.
Example prompt:
List every hosted single-cell model compatible with this dataset and quote me the cost of embedding it with each one. Run them all once I approve, with one run per model.
- Review and approve the runs when prompted. The 15 runs were quoted at 4.7 credits in total, from 0.18 for scGPT to 0.63 for c2s_2b.
Example prompt:
When the runs finish, download every embedding to data/embeddings, one <model>.npy file per model. Tell me about any model that failed.
- All 15 runs succeeded.
4Check the embeddings line up
- Check each downloaded embedding has one finite row per input cell.
- Use the input cell order for every model. Don't sort a matrix, a label table or an ID list on its own.
embeddings = {}
for path in sorted(EMBEDDINGS.glob('*.npy')):
    matrix = np.load(path, allow_pickle=False)
    assert matrix.ndim == 2 and matrix.shape[0] == data.n_obs, f'{path.name}: one row per input cell is required.'
    assert np.isfinite(matrix).all(), f'{path.name}: non-finite values.'
    embeddings[path.stem] = matrix.astype(np.float32)
assert embeddings, f'No embeddings found in {EMBEDDINGS}.'
display(pd.DataFrame([{'model': name, 'cells': m.shape[0], 'dimensions': m.shape[1]}
                      for name, m in embeddings.items()]))
model cells dimensions 0 c2s_2b 10000 2304 1 gf-12L-104M-i4096-CLcancer 10000 768 2 gf-12L-104M-i4096 10000 768 3 gf-12L-38M-i4096-CLcancer 10000 512 4 gf-12L-38M-i4096 10000 512 5 gf-12L-40M-i2048-CZI-CellxGene 10000 512 6 gf-12L-40M-i2048 10000 512 7 gf-18L-316M-i4096 10000 1152 8 gf-20L-151M-i4096 10000 896 9 gf-6L-10M-i2048 10000 256 10 nicheformer 10000 512 11 scgpt 10000 512 12 tf_exemplar 10000 2048 13 tf_metazoa 10000 2048 14 tf_sapiens 10000 2048
5Compare the models with scIB
- Set batch to species and label to tissue: a good co-embedding mixes species while keeping tissues apart.
- Include a PCA baseline computed from the counts (3,000 batch-aware highly variable genes, 50 components).
- Total is 0.6 × bio conservation + 0.4 × batch correction, as in the scIB paper. Isolated labels is turned off because every tissue occurs in every species.
- Some species differences are real biology, so perfect species mixing isn't the goal.
from scib_metrics.benchmark import Benchmarker, BioConservation, BatchCorrection

# Unintegrated baseline: 50 PCs on 3,000 batch-aware highly variable genes.
baseline = data.copy()
sc.pp.normalize_total(baseline, target_sum=1e4)
sc.pp.log1p(baseline)
sc.pp.highly_variable_genes(baseline, n_top_genes=3000, batch_key='species')
sc.tl.pca(baseline, n_comps=50, mask_var='highly_variable', random_state=SEED)
data.obsm['PCA'] = baseline.obsm['X_pca']
for name, matrix in embeddings.items():
    data.obsm[name] = matrix

benchmark = Benchmarker(
    data, batch_key='species', label_key='tissue',
    embedding_obsm_keys=['PCA', *embeddings],
    bio_conservation_metrics=BioConservation(isolated_labels=False),
    batch_correction_metrics=BatchCorrection(),
    pre_integrated_embedding_obsm_key='PCA', n_jobs=4, progress_bar=False,
)
benchmark.benchmark()
scib_results = benchmark.get_results(min_max_scale=False).drop(index='Metric Type').astype(float)
scib_results = scib_results.sort_values('Total', ascending=False).rename_axis('model').reset_index()
scib_results['n_dimensions'] = scib_results['model'].map(lambda m: data.obsm[m].shape[1])
summary_columns = {'model': 'Model', 'Total': 'scIB Total', 'Bio conservation': 'Tissue conservation',
                   'Batch correction': 'Species mixing', 'n_dimensions': 'Dimensions'}
display(scib_results[list(summary_columns)].rename(columns=summary_columns).style.format(
    {'scIB Total': '{:.3f}', 'Tissue conservation': '{:.3f}', 'Species mixing': '{:.3f}'}).hide(axis='index'))

foundation_ranking = scib_results.loc[scib_results['model'].ne('PCA')]
best_model = foundation_ranking.iloc[0]['model']
if len(foundation_ranking) >= 2:
    gap = foundation_ranking.iloc[0]['Total'] - foundation_ranking.iloc[1]['Total']
    if gap < .01:
        display(Markdown(f"**Narrow winner:** `{best_model}` leads `{foundation_ranking.iloc[1]['model']}` "
                         f'by only **{gap:.4f}** scIB points.'))

ranking = scib_results.melt(id_vars='model', value_vars=['Total', 'Bio conservation', 'Batch correction'],
                            var_name='score', value_name='value')
fig, ax = plt.subplots(figsize=(9, max(4, 0.35 * len(scib_results))))
sns.barplot(data=ranking, y='model', x='value', hue='score', ax=ax)
ax.axvline(scib_results.loc[scib_results['model'].eq('PCA'), 'Total'].item(), color='grey', linestyle='--')
ax.set(title='scIB scores; dashed line is the PCA baseline Total', xlabel='', ylabel='')
plt.tight_layout(); plt.savefig(FIGURES / 'scib_ranking.png', dpi=150); plt.show()
<pandas.io.formats.style.Styler at 0x37f0352b0>
<IPython.core.display.Markdown object>
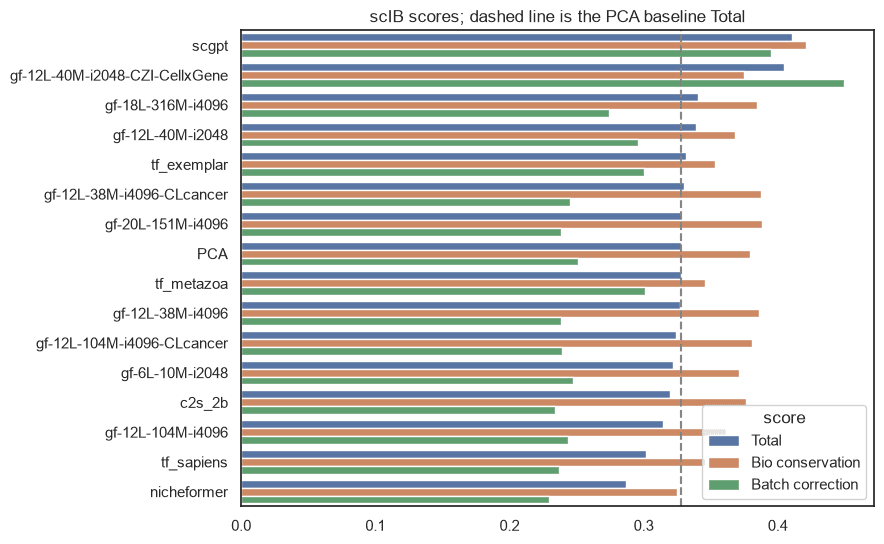
- scGPT (0.410) and gf-12L-40M-i2048-CZI-CellxGene (0.405) score highest on Total, 0.005 apart. scGPT keeps tissues more distinct; the CZI Geneformer mixes species more.
- The PCA baseline scores 0.328. Only seven models score above it, most by less than 0.02. tf_sapiens (0.302) and nicheformer (0.286) score lowest.
- Read bio conservation and batch correction separately: Total hides which one you're getting.
6Look at the top-scoring co-embedding
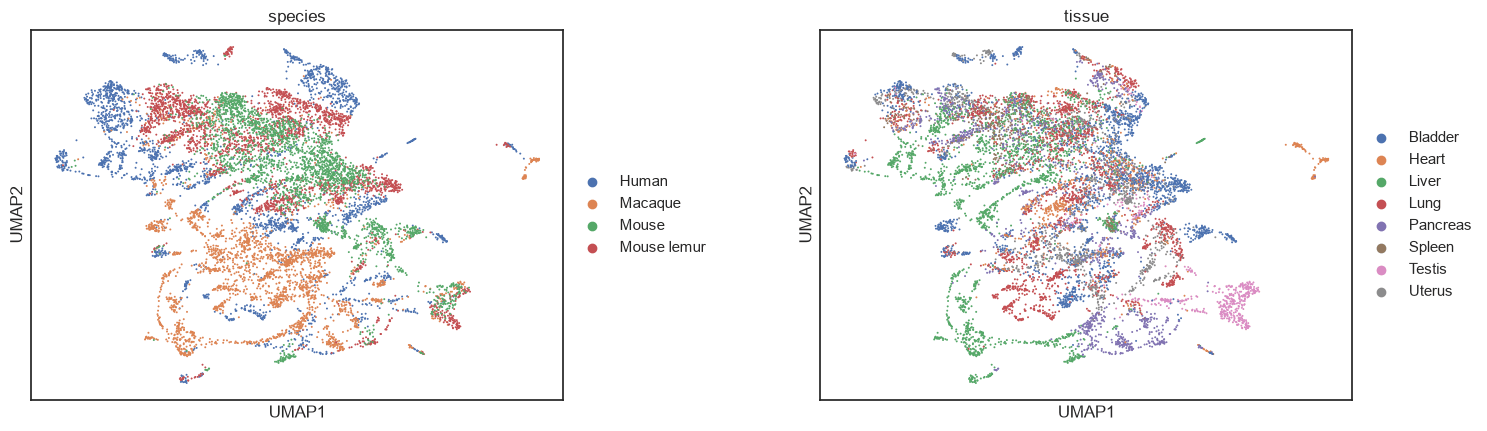
- The figure colours one scGPT UMAP by species and by tissue. Neither label is used to compute it.
- Species structure is still visible. Label transfer can still work, because mixing and transfer measure different things.
display(Markdown(f'**Selected foundation model:** `{best_model}`'))
sc.pp.neighbors(data, use_rep=best_model, n_neighbors=15, metric='cosine', random_state=SEED)
sc.tl.umap(data, random_state=SEED)
sc.pl.umap(data, color=['species', 'tissue'], wspace=0.35, size=8, show=False)
plt.savefig(FIGURES / 'best_model_coembedding.png', dpi=150, bbox_inches='tight')
plt.show()
<IPython.core.display.Markdown object>
7Transfer human labels to other primates
- Train a classifier on the top-scoring model's embeddings of human cells only. Macaque and mouse lemur labels are used only for scoring.
- Map annotations to broad cell classes shared across species; for example, T-cell subsets become "T / NKT cell". Fine subtypes aren't compared. Labels that are too vague to map, such as "Unannotated" or "Myeloid cell", are left out of scoring and count against coverage.
- The classifier is a class-balanced logistic regression, with regularisation picked by cross-validation on human cells.
- Tissue labels from all species were used to pick the model, so treat this as exploratory rather than a fully held-out test.
BROAD_CLASSES = {
    "T / NKT cell": ["T cell", "T cell/NKT cell", "CD4-positive, alpha-beta T cell", "CD8-positive, alpha-beta T cell", "naive thymus-derived CD4-positive, alpha-beta T cell", "naive thymus-derived CD8-positive, alpha-beta T cell", "regulatory T cell", "mature NK T cell"],
    "NK cell": ["natural killer cell"],
    "Innate lymphoid cell": ["innate lymphoid cell"],
    "B cell": ["B cell"],
    "Plasma cell": ["Plasma cell", "Plasma B cell", "plasma cell"],
    "Monocyte": ["Monocyte", "monocyte", "classical monocyte", "intermediate monocyte", "non-classical monocyte"],
    "Macrophage": ["Macrophage", "macrophage", "alveolar macrophage", "tissue-resident macrophage"],
    "Dendritic cell": ["Dendritic cell", "dendritic cell", "conventional dendritic cell", "myeloid dendritic cell"],
    "Plasmacytoid dendritic cell": ["plasmacytoid dendritic cell"],
    "Neutrophil": ["Neutrophil", "neutrophil"],
    "Mast cell / basophil": ["Mast cell", "mast cell", "basophil"],
    "Erythroid cell": ["Erythroid cell", "Erythroblast", "erythrocyte", "erythroid lineage cell", "erythroid progenitor cell"],
    "Hematopoietic precursor": ["hematopoietic precursor cell"],
    "Endothelial cell": ["Endothelial cell", "endothelial cell", "capillary endothelial cell", "cardiac endothelial cell", "endothelial cell of artery", "endothelial cell of hepatic sinusoid", "vein endothelial cell", "Liver endothelial cell 1", "Liver endothelial cell 2", "Digestive tract endothelial cell 2", "Epidermal endothelial cell"],
    "Lymphatic endothelial cell": ["endothelial cell of lymphatic vessel"],
    "Fibroblast / stromal cell": ["Fibroblast", "fibroblast", "fibroblast of cardiac tissue", "fibroblast of lung", "alveolar adventitial fibroblast", "adventitial cell", "Stromal cell", "stromal cell", "Uterus stromal cell", "Tongue stromal cell", "Digestive tract stromal cell", "Adipocyte progenitor/stromal cell", "Mesenchymal cell"],
    "Myofibroblast": ["myofibroblast cell"],
    "Pericyte": ["pericyte"],
    "Smooth muscle cell": ["Smooth muscle cell", "smooth muscle cell", "vascular associated smooth muscle cell", "bronchial smooth muscle cell", "Epidermal smooth muscle cell", "Male reproductive smooth muscle cell", "myometrial cell"],
    "Stellate cell": ["Stellate cell", "hepatic stellate cell", "pancreatic stellate cell"],
    "Mesothelial cell": ["Mesothelial cell", "mesothelial cell", "Viseral adipose mesothelial cell"],
    "Adipocyte": ["Adipocyte", "Adipocyte cell", "adipocyte"],
    "Cardiomyocyte": ["Cardiomyocyte", "cardiac muscle cell", "regular atrial cardiac myocyte", "regular ventricular cardiac myocyte", "ventricular cardiac muscle cell"],
    "Hepatocyte": ["Hepatocyte", "hepatocyte"],
    "Cholangiocyte": ["intrahepatic cholangiocyte", "Bile ductal cell"],
    "Alveolar type 1 cell": ["AT1 cell", "Alveolar epithelial type 1 cell", "pulmonary alveolar type 1 cell"],
    "Alveolar type 2 cell": ["AT2 cell", "Alveolar epithelial type 2 cell", "pulmonary alveolar type 2 cell"],
    "Ciliated cell": ["Ciliated cell", "ciliated epithelial cell", "lung multiciliated epithelial cell", "Respiratory ciliated cell", "Female reproductive ciliated cell"],
    "Club / goblet cell": ["Club cell", "club cell", "respiratory tract goblet cell", "Goblet/serous cell"],
    "Basal cell": ["Basal cell", "basal cell", "Male reproductive basal cell"],
    "Urothelial cell": ["Bladder urothelial cell", "bladder urothelial cell", "Bladder intermediate cell"],
    "Pancreatic acinar cell": ["Pancreas acinar cell", "pancreatic acinar cell", "Acinar cell"],
    "Pancreatic ductal cell": ["pancreatic ductal cell"],
    "Pancreatic endocrine cell": ["type B pancreatic cell", "pancreatic A cell", "Pancreatic endocrine cell"],
    "Uterine epithelial cell": ["epithelial cell of uterus", "Uterus luminal epithelial cell"],
    "Spermatogonium": ["Spermatogonia", "spermatogonium"],
    "Spermatocyte": ["Spermatocyte", "spermatocyte"],
    "Spermatid": ["Spermatid", "spermatid"],
    "Sertoli cell": ["Sertoli cell"],
    "Leydig cell": ["Leydig cell"],
    "Peritubular myoid cell": ["peritubular myoid cell"],
    "Neuron": ["Neuron", "neuron"],
}
LABEL_MAP = {label: broad for broad, labels in BROAD_CLASSES.items() for label in labels}
MIN_HUMAN_CELLS = 10

from sklearn.linear_model import LogisticRegression
from sklearn.model_selection import GridSearchCV, StratifiedKFold
from sklearn.pipeline import make_pipeline
from sklearn.preprocessing import StandardScaler

data.obs['cell_type_broad'] = data.obs['cell_type'].astype(str).map(LABEL_MAP)
species = data.obs['species'].astype(str).to_numpy()
broad = data.obs['cell_type_broad'].to_numpy(dtype=object)
human_counts = pd.Series(broad[(species == 'Human') & pd.notna(broad)]).value_counts()
training_classes = sorted(human_counts[human_counts >= MIN_HUMAN_CELLS].index)
train = (species == 'Human') & np.isin(broad, training_classes)
target = np.isin(species, PRIMATES)

display(Markdown(f'**Cell-type harmonization:** {data.obs["cell_type"].nunique()} source labels map to '
                 f'{len(BROAD_CLASSES)} broad classes; {len(training_classes)} have at least '
                 f'{MIN_HUMAN_CELLS} human cells and are used for training.'))
label_mapping = (data.obs.groupby(['cell_type', 'cell_type_broad'], observed=True, dropna=False)
                 .size().rename('cells').reset_index())
display(label_mapping)

coverage = pd.DataFrame({'species': species[target], 'tissue': data.obs['tissue'].astype(str).to_numpy()[target],
                         'supported': np.isin(broad[target], training_classes)})
display(Markdown('**Which target cells have a supported human reference label?**'))
display(coverage.groupby(['species', 'tissue'])['supported'].agg(['size', 'mean'])
        .rename(columns={'size': 'cells', 'mean': 'coverage'}).round(3))

x = data.obsm[best_model]
search = GridSearchCV(
    make_pipeline(StandardScaler(), LogisticRegression(class_weight='balanced', max_iter=1500, random_state=SEED)),
    {'logisticregression__C': [0.01, 0.1, 1.0]}, scoring='f1_macro',
    cv=StratifiedKFold(5, shuffle=True, random_state=SEED), n_jobs=-1,
)
search.fit(x[train], broad[train].astype(str))
classifier = search.best_estimator_
display(Markdown(f"**Human validation:** macro F1 {search.best_score_:.3f} at C = "
                 f"{search.best_params_['logisticregression__C']} (5-fold cross-validation on "
                 f'{train.sum():,} human cells; cell-level splits, so this does not test new donors).'))
classes = classifier.classes_
probabilities = classifier.predict_proba(x[target])
predicted = classes[probabilities.argmax(axis=1)]
print(f'Trained on {train.sum():,} human cells; predicted {target.sum():,} primate cells.')
<IPython.core.display.Markdown object>
                                  cell_type            cell_type_broad  cells
0                                  AT1 cell       Alveolar type 1 cell     23
1                                  AT2 cell       Alveolar type 2 cell     46
2                               Acinar cell     Pancreatic acinar cell      4
3                                 Adipocyte                  Adipocyte     20
4                            Adipocyte cell                  Adipocyte      1
..                                      ...                        ...    ...
180                  type B pancreatic cell  Pancreatic endocrine cell     18
181                                 unknown                        NaN    142
182  vascular associated smooth muscle cell         Smooth muscle cell     83
183                   vein endothelial cell           Endothelial cell     49
184         ventricular cardiac muscle cell              Cardiomyocyte     18

[185 rows x 3 columns]
<IPython.core.display.Markdown object>
                      cells  coverage
species     tissue
Macaque     Bladder     524     0.956
            Heart       187     0.781
            Liver       524     0.781
            Lung        475     0.844
            Pancreas    292     0.750
            Spleen       97     0.804
            Testis      129     0.636
            Uterus      272     0.816
Mouse lemur Bladder     524     0.977
            Heart       187     0.631
            Liver       524     0.910
            Lung        475     0.935
            Pancreas    292     0.901
            Spleen       97     0.856
            Testis      129     1.000
            Uterus      272     0.993
<IPython.core.display.Markdown object>
Trained on 2,465 human cells; predicted 5,000 primate cells.
8Score the transfer
- The main score is macro one-vs-rest AUROC: one AUROC per cell class, averaged with equal weight.
- Read it with coverage: the share of target cells whose label exists in the human training set.
- The tissue-only baseline predicts cell types from human cell-type frequencies within each tissue, without embeddings. It shows how much of the score tissue identity alone explains.
from sklearn.metrics import roc_auc_score, balanced_accuracy_score, f1_score

truth = broad[target]
target_obs = data.obs.loc[target, ['species', 'tissue']].astype(str).reset_index(drop=True)

# Tissue-only baseline: human cell-type frequencies within each tissue, no embeddings.
human_tissue = pd.crosstab(data.obs['tissue'][train], broad[train]).reindex(columns=classes, fill_value=0) + 1
tissue_prior = (human_tissue.div(human_tissue.sum(axis=1), axis=0)
                .reindex(target_obs['tissue']).to_numpy())


def macro_auc(y, scores):
    aucs = [roc_auc_score(y == label, scores[:, k]) for k, label in enumerate(classes)
            if (y == label).any() and (y != label).any()]
    return float(np.mean(aucs)) if aucs else np.nan


def score_scope(mask):
    supported = mask & np.isin(truth, classes)
    y = truth[supported].astype(str)
    return {'n_target': int(mask.sum()), 'n_evaluable': int(supported.sum()),
            'label_coverage': supported.sum() / max(mask.sum(), 1),
            'auc_macro_ovr': macro_auc(y, probabilities[supported]),
            'tissue_prior_auc_macro_ovr': macro_auc(y, tissue_prior[supported]),
            'balanced_accuracy': balanced_accuracy_score(y, predicted[supported]) if supported.any() else np.nan,
            'macro_f1': f1_score(y, predicted[supported], average='macro') if supported.any() else np.nan}


rows = [{'scope': 'all_primates', 'species': 'All primates', 'tissue': 'All',
         **score_scope(np.ones(len(truth), bool))}]
for name in PRIMATES:
    rows.append({'scope': 'species', 'species': name, 'tissue': 'All',
                 **score_scope(target_obs['species'].eq(name).to_numpy())})
    for tissue in sorted(target_obs['tissue'].unique()):
        rows.append({'scope': 'species_tissue', 'species': name, 'tissue': tissue,
                     **score_scope((target_obs['species'].eq(name) & target_obs['tissue'].eq(tissue)).to_numpy())})
transfer_metrics = pd.DataFrame(rows)
metric_names = {'species': 'Species', 'tissue': 'Tissue', 'n_target': 'Target cells', 'n_evaluable': 'Scored cells',
                'label_coverage': 'Coverage', 'auc_macro_ovr': 'Macro AUC', 'tissue_prior_auc_macro_ovr': 'Tissue-only AUC',
                'balanced_accuracy': 'Balanced accuracy', 'macro_f1': 'Macro F1'}
formats = {'Coverage': '{:.1%}', 'Macro AUC': '{:.3f}', 'Tissue-only AUC': '{:.3f}',
           'Balanced accuracy': '{:.3f}', 'Macro F1': '{:.3f}'}
for scopes, title in [(['all_primates', 'species'], 'Overall and species-specific transfer'),
                      (['species_tissue'], 'Within matched tissues')]:
    display(Markdown('**' + title + '**'))
    display(transfer_metrics.loc[transfer_metrics['scope'].isin(scopes), list(metric_names)]
            .rename(columns=metric_names).style.format(formats, na_rep='Undefined').hide(axis='index'))

supported = np.isin(truth, classes)
per_class_auc = pd.DataFrame([
    {'cell_class': label, 'positives': int((truth[supported] == label).sum()),
     'auroc': roc_auc_score(truth[supported] == label, probabilities[supported, k])}
    for k, label in enumerate(classes)
    if (truth[supported] == label).any() and (truth[supported] != label).any()]).sort_values('auroc')
display(Markdown('**Per-class discrimination and support**'))
display(per_class_auc.round(3))

confusion = pd.crosstab(pd.Series(truth[supported], name='Ground truth'),
                        pd.Series(predicted[supported], name='Prediction'), normalize='index')
fig, ax = plt.subplots(figsize=(14, 11))
sns.heatmap(confusion, cmap='Blues', vmin=0, vmax=1, ax=ax)
ax.set_title(f'{best_model}: human-trained predictions on macaque and mouse lemur (row-normalised)')
plt.tight_layout(); plt.savefig(FIGURES / 'label_transfer_confusion.png', dpi=150); plt.show()
<IPython.core.display.Markdown object>
<pandas.io.formats.style.Styler at 0x15d206210>
<IPython.core.display.Markdown object>
<pandas.io.formats.style.Styler at 0x15d206210>
<IPython.core.display.Markdown object>
                    cell_class  positives  auroc
3                   Basal cell         22  0.690
9               Erythroid cell         17  0.772
28               Stellate cell         43  0.847
24                 Plasma cell         82  0.892
21      Pancreatic ductal cell          7  0.917
8             Endothelial cell        454  0.926
26                   Spermatid        108  0.928
16                    Monocyte        105  0.937
25          Smooth muscle cell        150  0.937
2                       B cell        207  0.942
10   Fibroblast / stromal cell        674  0.950
15            Mesothelial cell        123  0.954
18                     NK cell         71  0.958
5                Cholangiocyte         91  0.962
23                    Pericyte         16  0.964
31     Uterine epithelial cell         54  0.969
4                Cardiomyocyte         41  0.975
13                  Macrophage        495  0.976
1         Alveolar type 2 cell         68  0.980
29                T / NKT cell        648  0.981
0         Alveolar type 1 cell         51  0.984
17               Myofibroblast         68  0.985
12  Lymphatic endothelial cell         13  0.985
7           Club / goblet cell         26  0.986
30             Urothelial cell        113  0.988
6                Ciliated cell         35  0.989
19                  Neutrophil        353  0.993
11                  Hepatocyte         77  0.997
27                Spermatocyte         49  0.997
20      Pancreatic acinar cell         90  1.000
22   Pancreatic endocrine cell          2  1.000
14        Mast cell / basophil          1  1.000
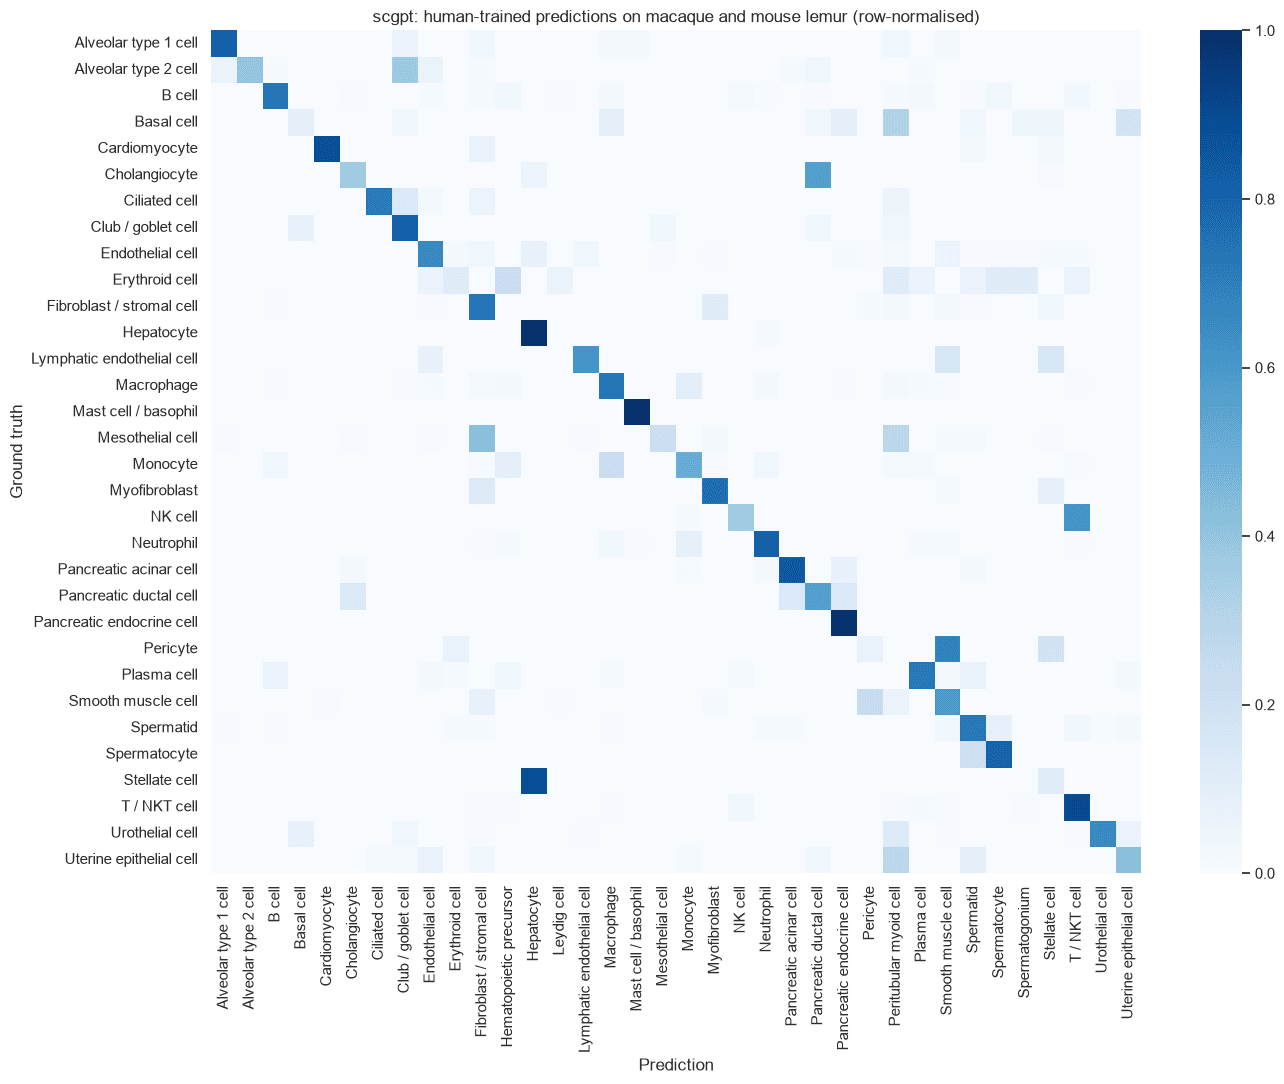
- Across 5,000 primate cells, macro AUROC is 0.949, against 0.724 for the tissue-only baseline. Coverage is 87.1% (4,354 cells scored).
- Mouse lemur: AUROC 0.979 with 91.8% coverage. Macaque: AUROC 0.923 with 82.3% coverage, lower because more macaque labels are too vague to map.
- Within tissues, macaque testis (0.645) and spleen (0.815) are the hardest transfers.
9Compare ground truth and predictions on one UMAP
- Each pair of panels shows the same primate cells and coordinates: curated labels on the left, predictions on the right, with shared colours.
- Cells without a supported label stay visible in grey.
predictions = pd.DataFrame({'cell_id': data.obs_names[target], **target_obs,
                            'cell_type_harmonized': truth, 'prediction': predicted})
palette = dict(zip(classes, sns.color_palette('husl', len(classes)).as_hex()))
coords = data.obsm['X_umap'][target]
fig, axes = plt.subplots(len(PRIMATES), 2, figsize=(16, 7 * len(PRIMATES)), squeeze=False)
for row, name in zip(axes, PRIMATES):
    in_species = predictions['species'].eq(name).to_numpy()
    for ax, column in zip(row, ['cell_type_harmonized', 'prediction']):
        values = predictions.loc[in_species, column].to_numpy(dtype=object)
        colours = [palette.get(v, '#d0d0d0') for v in values]
        ax.scatter(coords[in_species, 0], coords[in_species, 1], c=colours, s=6, linewidths=0)
        ax.set_title(f'{name}: {"ground truth" if column == "cell_type_harmonized" else "prediction"}')
        ax.set_aspect('equal'); ax.axis('off')
fig.legend(handles=[plt.Line2D([], [], marker='o', linestyle='', color=c, label=l) for l, c in palette.items()],
           loc='lower center', ncol=4, frameon=False)
fig.tight_layout(rect=(0, 0.12, 1, 1))
plt.savefig(FIGURES / 'label_transfer_umap.png', dpi=150, bbox_inches='tight'); plt.show()
display(Markdown(f'**Predictions:** {len(predictions):,} target cells; grey cells have no supported label.'))
display(predictions.head(12))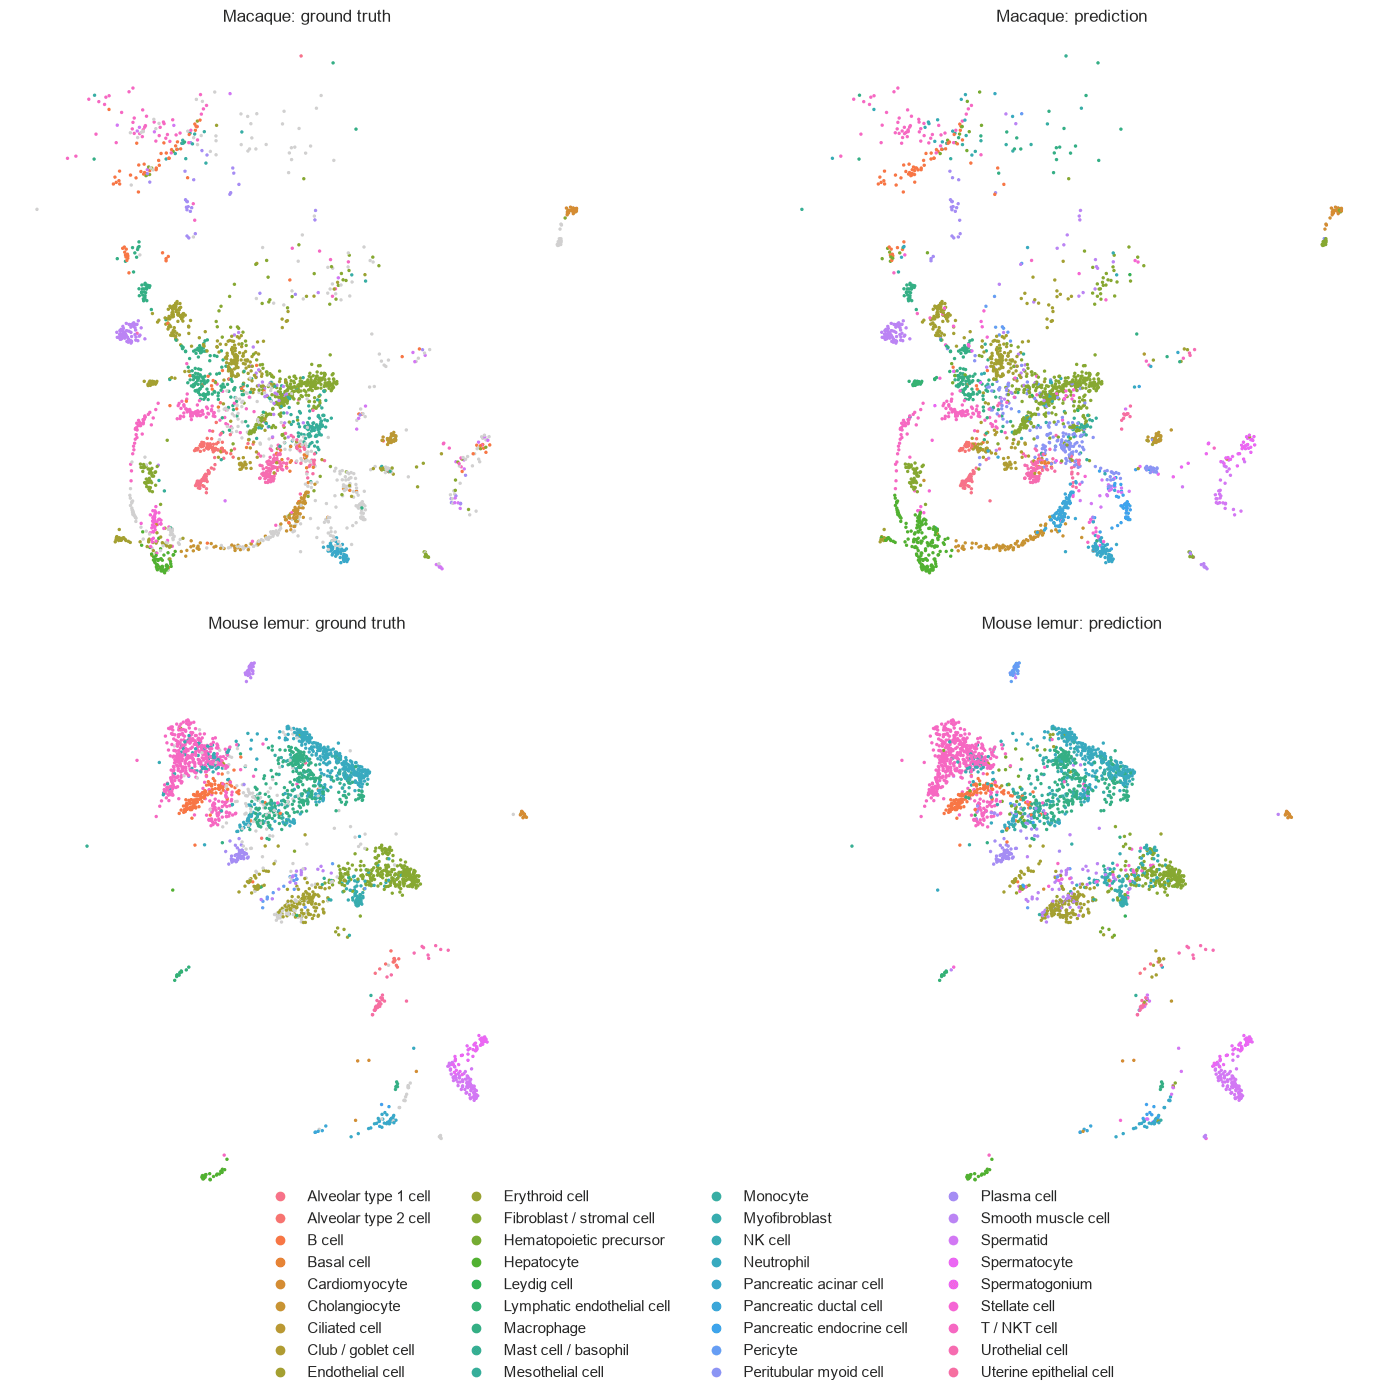
<IPython.core.display.Markdown object>
                                            cell_id  species   tissue  \
0   Macaque|Bladder_AAACCCAAGGCCCGTT-1-monkey_atlas  Macaque  Bladder
1   Macaque|Bladder_AAACGAAAGAGCCATG-1-monkey_atlas  Macaque  Bladder
2   Macaque|Bladder_AACCACACACATAACC-1-monkey_atlas  Macaque  Bladder
3   Macaque|Bladder_AAGGTAACAGTGGGTA-1-monkey_atlas  Macaque  Bladder
4   Macaque|Bladder_AAGTTCGCAGACACAG-1-monkey_atlas  Macaque  Bladder
5   Macaque|Bladder_ACAACCACATTGCCGG-1-monkey_atlas  Macaque  Bladder
6   Macaque|Bladder_AGAGAATCATCCGTTC-1-monkey_atlas  Macaque  Bladder
7   Macaque|Bladder_AGATCCACAAGGTCTT-1-monkey_atlas  Macaque  Bladder
8   Macaque|Bladder_AGGAGGTGTCTACAAC-1-monkey_atlas  Macaque  Bladder
9   Macaque|Bladder_AGTAGTCGTTAAGGGC-1-monkey_atlas  Macaque  Bladder
10  Macaque|Bladder_AGTCAACGTTCTATCT-1-monkey_atlas  Macaque  Bladder
11  Macaque|Bladder_CACGAATTCAAAGGAT-1-monkey_atlas  Macaque  Bladder

         cell_type_harmonized                 prediction
0                T / NKT cell               T / NKT cell
1                T / NKT cell               T / NKT cell
2                   Spermatid    Uterine epithelial cell
3                         NaN                 Macrophage
4                      B cell                 Macrophage
5                 Plasma cell                 Macrophage
6                      B cell           Endothelial cell
7   Fibroblast / stromal cell  Fibroblast / stromal cell
8                         NaN               T / NKT cell
9                         NaN                 Macrophage
10                        NaN               T / NKT cell
11 NaN Endothelial cell 10Summarise the results
- The summary below is generated from the results above.
pooled = transfer_metrics.query("scope == 'all_primates'").iloc[0]
by_species = transfer_metrics.query("scope == 'species'").set_index('species')
pca_total = scib_results.loc[scib_results['model'].eq('PCA'), 'Total'].item()
best_total = scib_results.loc[scib_results['model'].eq(best_model), 'Total'].item()
findings = (
    f'**{best_model}** scores highest on scIB Total ({best_total:.3f}, against {pca_total:.3f} for the PCA baseline). '
    f"Trained on human cells only, it reaches a macro AUROC of **{pooled['auc_macro_ovr']:.3f}** on "
    f"{int(pooled['n_evaluable']):,} of {int(pooled['n_target']):,} primate cells "
    f"({pooled['label_coverage']:.1%} coverage), against {pooled['tissue_prior_auc_macro_ovr']:.3f} for the tissue-only baseline. "
    + ' '.join(f"{name}: AUROC {by_species.loc[name, 'auc_macro_ovr']:.3f} with "
               f"{by_species.loc[name, 'label_coverage']:.1%} coverage." for name in PRIMATES)
)
display(Markdown(findings))
(OUTPUT / 'findings.md').write_text(findings + '\n')
<IPython.core.display.Markdown object>
333
11Save the results
- Save the scIB scores, transfer metrics, per-class AUROC, predictions and label mapping as CSV, next to the figures.
- Keep the downloaded embeddings: repeating the analysis needs no new run.
scib_results.to_csv(OUTPUT / 'scib_metrics.csv', index=False)
transfer_metrics.to_csv(OUTPUT / 'transfer_metrics.csv', index=False)
per_class_auc.to_csv(OUTPUT / 'per_class_auc.csv', index=False)
predictions.to_csv(OUTPUT / 'transfer_predictions.csv.gz', index=False)
label_mapping.to_csv(OUTPUT / 'label_mapping.csv', index=False)
(OUTPUT / 'analysis_settings.json').write_text(json.dumps({
    'seed': SEED, 'best_model': best_model, 'models': list(embeddings), 'training_classes': list(classes),
    'min_human_cells_per_class': MIN_HUMAN_CELLS, 'regularization_C': search.best_params_['logisticregression__C'],
}, indent=2))
print(f'Results and figures saved to {OUTPUT}')
Results and figures saved to results
Takeaways
- One prompt ran all 15 hosted single-cell models on the same cells. You choose the cohort, the labels and how to score the results.
- The workflow is model-agnostic: compare every model on your own data, then pick one for the next step.
- Score baselines next to the models (PCA for integration, tissue-only for transfer), so each number has a reference point.
- Report coverage with any transfer score: an AUROC only describes the cells that could be scored.
- This analysis is one of many computational experiments you can run in Helical, the virtual AI lab for biology.
References
- Luecken MD, et al. Benchmarking atlas-level data integration in single-cell genomics. Nature Methods 2022;19:41–50. 10.1038/s41592-021-01336-8
- scib-metrics documentation
- Helical open-source package: model implementations