Recipe
Predicting an IL1B knockout across an LPS time course
PerturbGen (Ly, Miraki Feriz, Isobe et al., bioRxiv 2026) is a generative model that predicts how a perturbation at one point of a trajectory reshapes cells further along it. One of the headline experiments in the paper is an in vivo LPS challenge: healthy volunteers get intravenous LPS, PBMCs are profiled at 90 minutes, 6 hours and 10 hours, and the authors knock out IL1B in silico in myeloid cells at 90 minutes to see how the later response changes (Fig. 2). IL1B peaks at 90 minutes and the knockout is predicted to dampen interferon- and NF-κB-associated genes at 6 and 10 hours.
That experiment is exactly the kind of thing you can reproduce with a few prompts in the Helical MCP. In this cookbook you rerun the knockout from Fig. 2d: start from monocytes and dendritic cells at 90 minutes, predict them at 6 and 10 hours with and without IL1B, and compare response genes at 10 hours the way Fig. 2f does.
- Inspect the dataset and plot a UMAP of the time course.
- Set up the IL1B knockout and get a quote.
- Run it and download the predictions.
- Compare unperturbed and knockout predictions at 10 hours.
You need the Helical MCP connected (see Getting started) and about 1.3 credits.
1Inspect the dataset
The dataset is a human peripheral blood atlas sampled before LPS stimulation and at 90 minutes, 6 hours and 10 hours after it.
Example prompt:
Load and inspect the lps_otar.h5ad single-cell dataset. Report the number of cells and genes, the available metadata annotations (cell type, time point, condition), and any existing embeddings or quality-control metrics. Then make a UMAP coloured separately by cell type and by time point, to get an overview of the cellular composition and how it changes across the LPS time course.
- Output: 223,478 cells and 13,826 genes.
Xholds raw integer counts and the gene index is Ensembl IDs. - The columns you need for this workflow:
| Column | What it holds |
|---|---|
time_after_LPS | normal (148,107 cells), 90m_LPS (10,685), 6h_LPS (43,803), 10h_LPS (20,883) |
cell_type_harmonized | 15 cell types, from CD4+ T cells (57,329) to haematopoietic stem cells (227) |
donor_id, study | 58 samples from two studies |
- The file already carries QC metrics (
n_genes,total_counts,pct_counts_mt, doublet scores) but no embeddings, so the UMAP is computed locally from 2,000 highly variable genes.
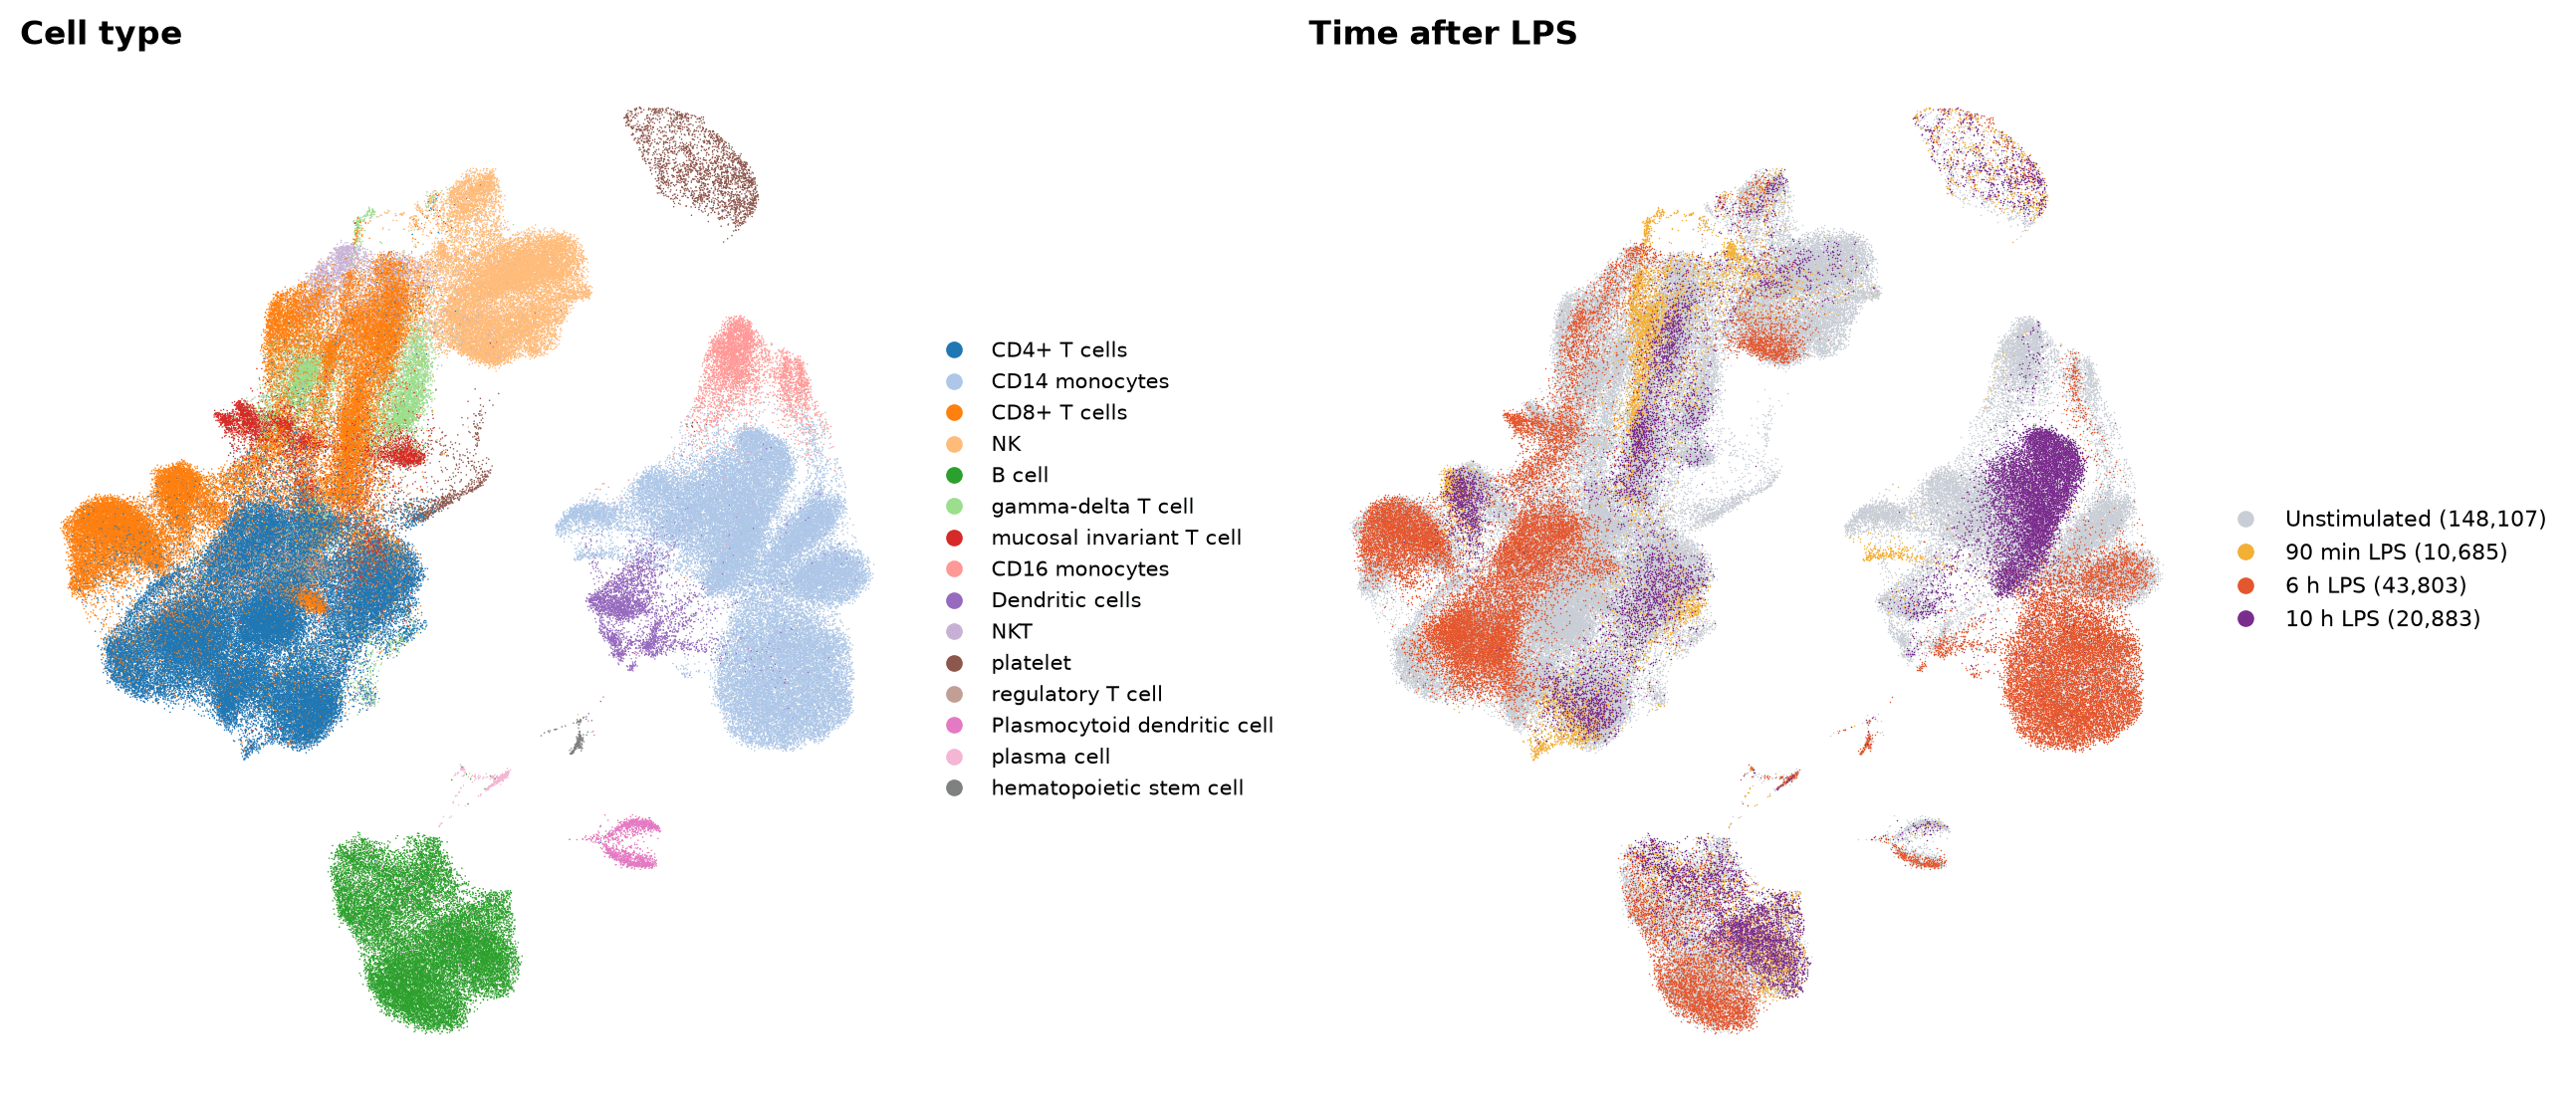
- Cell types form separate groups. Within each group, cells shift by time point, and monocytes move the most: the 6 h and 10 h monocytes form their own clusters.
2Set up the knockout and get a quote
As in the paper, PerturbGen masks the target gene in each source cell, then predicts that cell at later time points. Every source cell is predicted twice: once unedited (the control) and once with IL1B masked. The source time point is 90 minutes, where IL1B peaks, and the cell types are the three myeloid subsets the paper looks at.
Example prompt:
Register the dataset to the Helical Platform. Then set up an in-silico IL1B knockout to predict how these cells respond to LPS at 6 and 10 hours. Use time_after_LPS="90m_LPS", and subset cell_type_harmonized to ["CD14 monocytes","CD16 monocytes","Dendritic cells"]. Set target_genes=["ENSG00000125538"] for IL1B, n_cells_perturbed=2000, and pred_tps=[1,2] for 6 h and 10 h. Show me the quote and wait for approval.
- After upload, the platform reads the file back and confirms 223,478 cells and 13,826 genes. It also warns that the gene index holds Ensembl IDs. That is expected here: the target gene is given as an Ensembl ID too.
- The quote is at most 1.33 credits for one job. Nothing has run yet, and nothing has been charged.
3Run the knockout
Example prompt:
Approve. Check every 2 minutes and tell me when the run finishes. If it succeeds, download its AnnData artifact.
- The run took about 5 minutes.
- The artifact is one AnnData with 3,206 predicted cells (1,603 at 6 h and 1,603 at 10 h) over PerturbGen's 1,856-gene vocabulary:
.X: predicted counts with IL1B knocked out.layers["pred_counts"]: predicted counts without the knockout.layers["true_counts"]: the measured counts of the source cells.
- Only 360 myeloid cells were sampled at 90 minutes, so the 2,000 requested cells are drawn from that pool. Cells that do not express IL1B are dropped, which leaves 288 distinct source cells behind the 1,603 predictions.
4Compare the predictions at 10 hours
Example prompt:
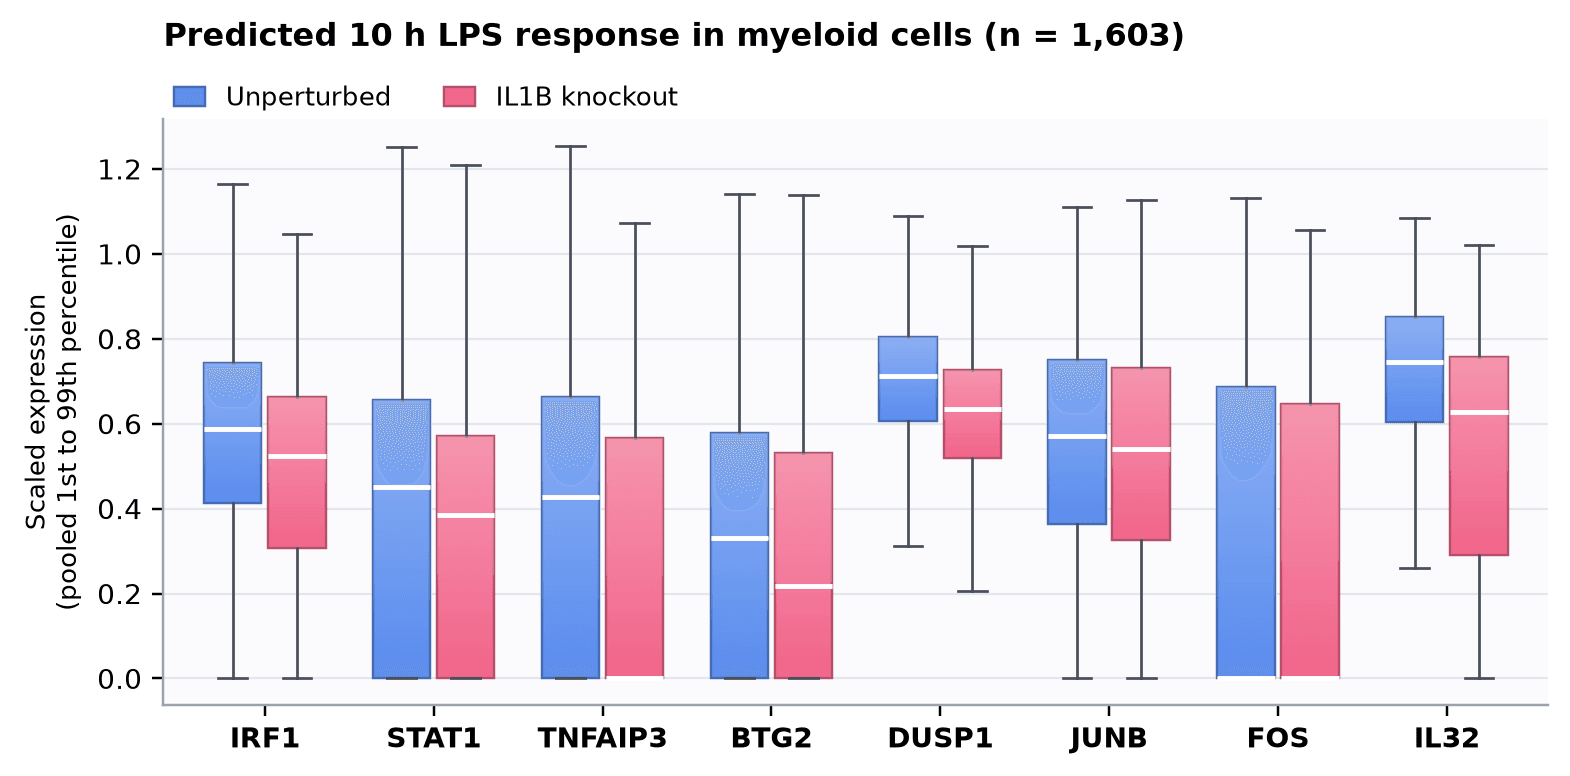
From the run's AnnData artifact, use the 10h_LPS predictions and pool CD14 monocytes, CD16 monocytes, and Dendritic cells. Compare unperturbed predictions from layers["pred_counts"] with IL1B-knockout predictions from .X. Select genes by these Ensembl IDs in var_names, then use the listed symbols as plot labels: IRF1=ENSG00000125347, STAT1=ENSG00000115415, TNFAIP3=ENSG00000118503, BTG2=ENSG00000159388, DUSP1=ENSG00000120129, JUNB=ENSG00000171223, IL32=ENSG00000008517. Normalize each cell to 10,000 counts, apply log1p, then scale each gene using its pooled 1st to 99th percentile range across both conditions. Make a compact vertical grouped boxplot with no significance annotations.
- Output: the figure at the top of this page, 1,603 cells per condition.
- Median log-normalised expression, unperturbed versus knockout:
| Gene | Unperturbed | IL1B knockout |
|---|---|---|
| IRF1 | 2.69 | 2.40 |
| STAT1 | 1.83 | 1.57 |
| TNFAIP3 | 1.65 | 0.00 |
| BTG2 | 1.35 | 0.88 |
| DUSP1 | 4.33 | 3.85 |
| JUNB | 3.78 | 3.58 |
| IL32 | 4.87 | 4.09 |
- All seven genes are predicted lower without IL1B, the same direction as in the paper.
- These genes sit downstream of IL-1 and NF-κB signalling. The paper reads this as a reversal of the IL-1β stimulation signature and backs it up against an independent IL-1β stimulation dataset.
Takeaways
- Masking IL1B in 90-minute monocytes and dendritic cells lowers all seven LPS response genes at 10 hours, the same direction as in the paper.
- The effect lands where it should. Interferon (IRF1, STAT1), NF-κB (TNFAIP3) and AP-1 (JUNB) targets all go down, consistent with the paper's reading of the knockout as a reversal of the IL-1β signature.
- Three prompts reproduce the IL1B knockout: register, run, plot. Helical runs the model; you pick the cells, the gene and the readout.
- These are model predictions to prioritise wet-lab experiments, not measured knockouts.
- This knockout is one of many computational experiments you can run in Helical, the virtual AI lab for biology.