Recipe
Transferring cell type labels from healthy lung to IPF with Geneformer
The process of labeling groups of cells in a dataset based on phenotype, known as cell-type annotation, is one of the first steps in the analysis of single-cell data. If a well-annotated reference atlas exists for the same tissue, its labels can be transferred to the new dataset by embedding reference and query cells in the same representation space and assigning labels based on their nearest neighbours.
Disease datasets make this more challenging. Some cells may occupy states that are not present in the healthy reference, such as the aberrant basaloid cells observed in idiopathic pulmonary fibrosis (IPF). A useful label-transfer approach should therefore do two things: assign confident labels to cell states represented in the reference, while giving lower confidence to cells that do not closely match any known reference population.
Biological foundation models such as Geneformer and scGPT provide pretrained cell representations that can be used for this purpose. Running these models directly, however, requires downloading model weights, configuring the appropriate preprocessing pipeline, and often access to GPU compute. The Helical MCP handles this infrastructure and exposes the models through simple prompts.
In this cookbook, you use the Helical MCP to embed a healthy lung reference atlas and IPF lung cells with Geneformer-104M and scGPT, then perform label transfer using nearest-neighbour similarity in the resulting embedding spaces. The reference dataset is the Human Lung Cell Atlas (HLCA) core, while the query dataset comes from Adams et al. 2020 and contains both IPF and healthy lung samples.
As a sanity check, the transferred labels are compared with the published HLCA annotations for the Adams dataset, which were generated using a model trained specifically on the HLCA reference.
Steps:
- Prepare the reference and query for Helical.
- Register the data and get a quote.
- Run the embeddings.
- Transfer labels and check them against the authors' labels.
- Look at what the disagreements mean biologically.
- Find the cells that don't fit the healthy reference.
- Remove the batch effect from Geneformer and map again.
You need the Helical MCP connected (see Getting started) and about 0.75 credits.
Link to full chat: Label Transfer with the Helical MCP.
1Prepare the data
- Reference: HLCA core, 585,000 healthy lung cells with labels at five levels of detail (
ann_level_1toann_level_5). - Query: the Adams et al. (
Kaminski_2020) cells from the HLCA full atlas: IPF cells, including all 448 aberrant basaloid cells, and healthy controls from the same study. - The authors' own labels, mapped onto the HLCA levels (
original_ann_level_*), are the ground truth. HLCA's published transfer (transf_ann_level_*) is the comparison.
Example prompt:
I want to transfer cell type labels from a healthy lung reference to IPF cells. Get the data ready for Helical. Put large downloads in ~/data.

Reference: HLCA core from CELLxGENE (dataset 688185ad-11c2-4172-a53a-f4f1f4076860). Take about 30,000 cells, capped per ann_finest_level so rare types stay in.

Query: HLCA full (dataset 5f863718-02a6-46cb-83e7-52be988b915b). Keep study == "Kaminski_2020". Take about 20,000 cells with disease == "pulmonary fibrosis", and keep all Aberrant_Basaloid cells. Also take about 5,000 cells from the healthy control donors of the same study.

Try reading only the columns and rows you need before downloading whole files. Use raw counts, and convert the gene index from Ensembl IDs to gene symbols. Merge everything into one .h5ad with a column called split (reference, ipf_query, control_query), and keep donor, the author labels and HLCA's own transfer columns. Tell me if anything looks off, for example non-integer counts, labels missing for some cells, or genes that don't map to a symbol.
- Output: one 247 MB
.h5adwith 55,024 cells (30,024 reference, 20,000 IPF, 5,000 control) and 21,856 genes, with raw integer counts. - What the agent flagged:
- 5,123 reference genes and 14,625 query genes had Ensembl IDs with no gene symbol, so they were dropped, leaving 21,856 shared genes.
- Some duplicate gene symbols were merged by summing their counts.
- 3,854 reference cells come from healthy tissue next to a tumour.
- The finest label level is missing for many query cells, so the scoring below uses levels 3 and 4.
2Register the dataset and get a quote
Example prompt:
Register the prepared dataset to the Helical Platform and quote me what it costs to embed with scGPT and Geneformer-104M. Don't start anything yet.
- The platform read the file back as 55,024 cells × 21,856 genes, matching step 1, with no validation issues.
| Model | Credits |
|---|---|
| scGPT | 0.195 |
| Geneformer-104M | 0.555 |
| Total | 0.750 |
- Nothing has run yet, and nothing has been charged.
3Run the embeddings
Example prompt:
Run both embeddings on the registered dataset and download them to ./embeddings once they are finished.
- Review and approve each run when prompted. Runs only start after you approve them.
- Both runs together took about 26 minutes and charged 0.75 credits.
- You get one matrix per model (512 dimensions for scGPT, 768 for Geneformer-104M), with rows in the same order as the cells in your
.h5ad.
4Transfer the labels
Example prompt:
Use each embedding to transfer labels from the reference to the IPF cells. Score against the authors' labels at ann_level_3 and ann_level_4.

Keep it fair: use the same method for every embedding, tune only on the reference, only score cell types the reference has, and give intervals by resampling donors.
- The agent used a k-nearest-neighbour classifier: each IPF cell takes the majority label of its closest reference cells. It chose the number of neighbours on the reference alone.
- Scores are macro-F1 (the average agreement across cell types, so rare types count as much as common ones). Intervals come from resampling the 32 IPF donors.
| Level | scGPT | Geneformer-104M |
|---|---|---|
| Level 3 (broad types, e.g. "T cell lineage") | 0.714 (0.691–0.734) | 0.732 (0.710–0.749) |
| Level 4 (finer types, e.g. "CD8 T cells") | 0.544 (0.517–0.569) | 0.703 (0.677–0.725) |
- Geneformer-104M is clearly ahead at level 4, by 0.16. At level 3 the two are close.
5Check the labels
Example prompt:
How good are these labels? Compare them with HLCA's own published transfer as a sanity check, only counting cell types with at least 20 IPF cells. Show the most common wrong labels at level 4. If a mistake appears for every method, check with marker genes whether it's just a naming difference between the authors' labels and the reference, and if so, score again with those labels merged.
| Level | scGPT | Geneformer-104M | HLCA transfer |
|---|---|---|---|
| Level 3 | 0.751 | 0.763 | 0.780 |
| Level 4 | 0.614 | 0.784 | 0.782 |
| Level 4, secretory types merged | 0.723 | 0.891 | 0.883 |
- Geneformer-104M agrees with the authors as well as HLCA's purpose-built transfer, without any training on lung data.
- Labels from different atlases don't always line up. All three methods call some of the authors' Club and Goblet cells "Transitional Club-AT2". Those cells express secretory markers (SCGB1A1, SCGB3A2, MUC5B), so this is mostly a naming boundary between the two annotations, not a model error. Merging the three secretory types raises every score by about 0.1 and doesn't change the order.
6Do the disagreements make sense biologically?
Example prompt:
Do the main disagreements make sense biologically? For the macrophage, monocyte and T cell confusions, check marker genes in the cells involved and whether they match known IPF cell states. It is expected that some cell types (eg. macrophages and monocytes, or classical and non classical monocytes) are quite similar, and oftentimes there is quite a bit of disagreement on which should be called what. Help me distinguish what look like real biology and which look like model errors, and cite the papers you rely on.
- Macrophages: often real biology. Some cells the authors call alveolar macrophages are labelled interstitial macrophages. In Geneformer-104M's group, 32% express SPP1, against 3% of alveolar macrophages in the healthy controls, and they still express alveolar markers. That matches the SPP1-high macrophages known to build up in fibrotic lung (Morse et al. 2019). The healthy reference has no label for this state, so the nearest one wins.
- Monocytes: a fuzzy boundary. Classical and non-classical monocytes sit on a continuum (Patel et al. 2017), so some disagreement is expected.
- T cells: real errors. Cells called CD4 T cells still express CD8 and almost no CD4. Geneformer-104M makes this mistake in 190 cells, scGPT in 475 and HLCA in 25.
- A label that disagrees with the authors isn't always wrong. Look at the cells before you trust or dismiss a score.
7Find the cells that don't fit
Example prompt:
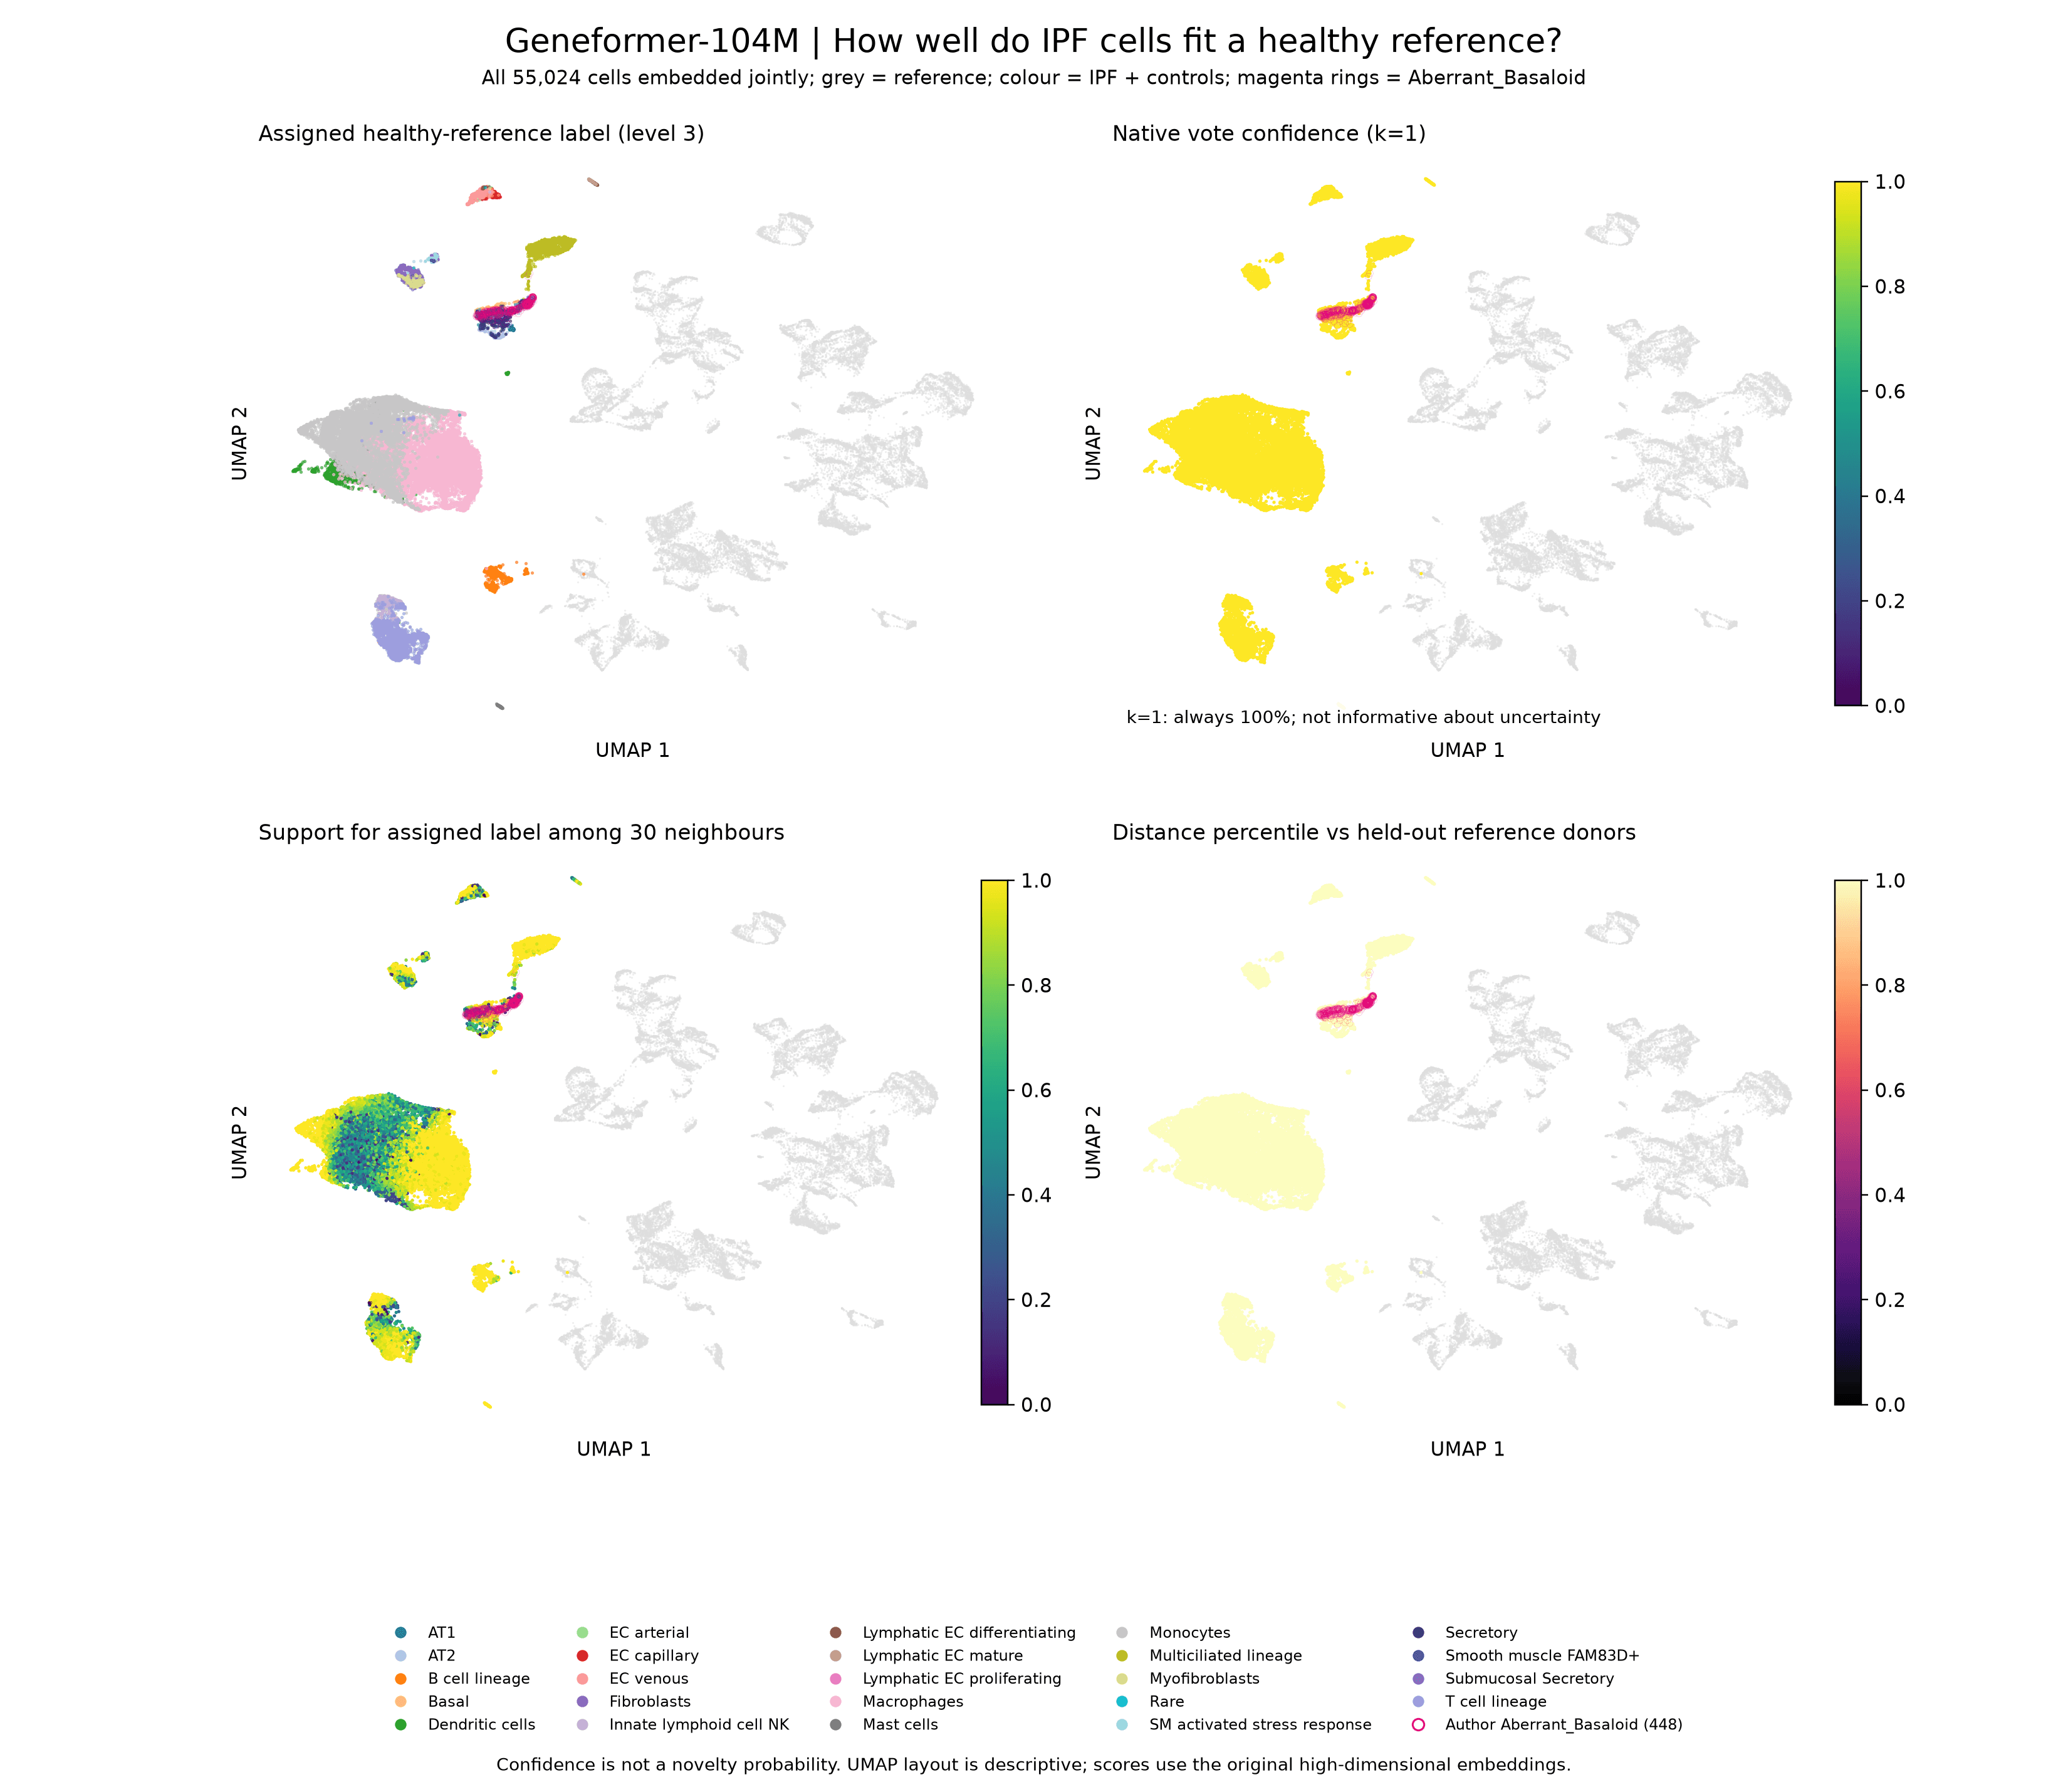
Which IPF cells don't fit the healthy reference? Use each method's confidence in its label, and compare Aberrant_Basaloid cells with AT2 cells from IPF and control donors. Then make UMAPs for scGPT and Geneformer-104M, coloured by predicted label and by confidence, with Aberrant_Basaloid cells marked. Save as PNG.
- Confidence here is the share of a cell's 30 nearest reference cells that agree with its label.
| Group | Cells / donors | scGPT | Geneformer-104M | HLCA confidence |
|---|---|---|---|---|
| Aberrant basaloid | 448 / 30 | 0.71 | 0.37 | 0.56 |
| IPF AT2 | 67 / 16 | 0.90 | 0.75 | 0.97 |
| Control AT2 | 140 / 15 | 0.93 | 0.78 | 0.97 |
- Every method gives the aberrant basaloid cells lower confidence than AT2 cells, and Geneformer-104M separates them most strongly.
- IPF AT2 and control AT2 look the same, so disease alone doesn't push AT2 cells off the reference. Aberrant basaloid cells are the genuinely new state.
- The agent flagged a problem: in Geneformer-104M, all query cells sit far from the reference, including the healthy controls. Part of that distance is a batch effect between the two studies, not biology.
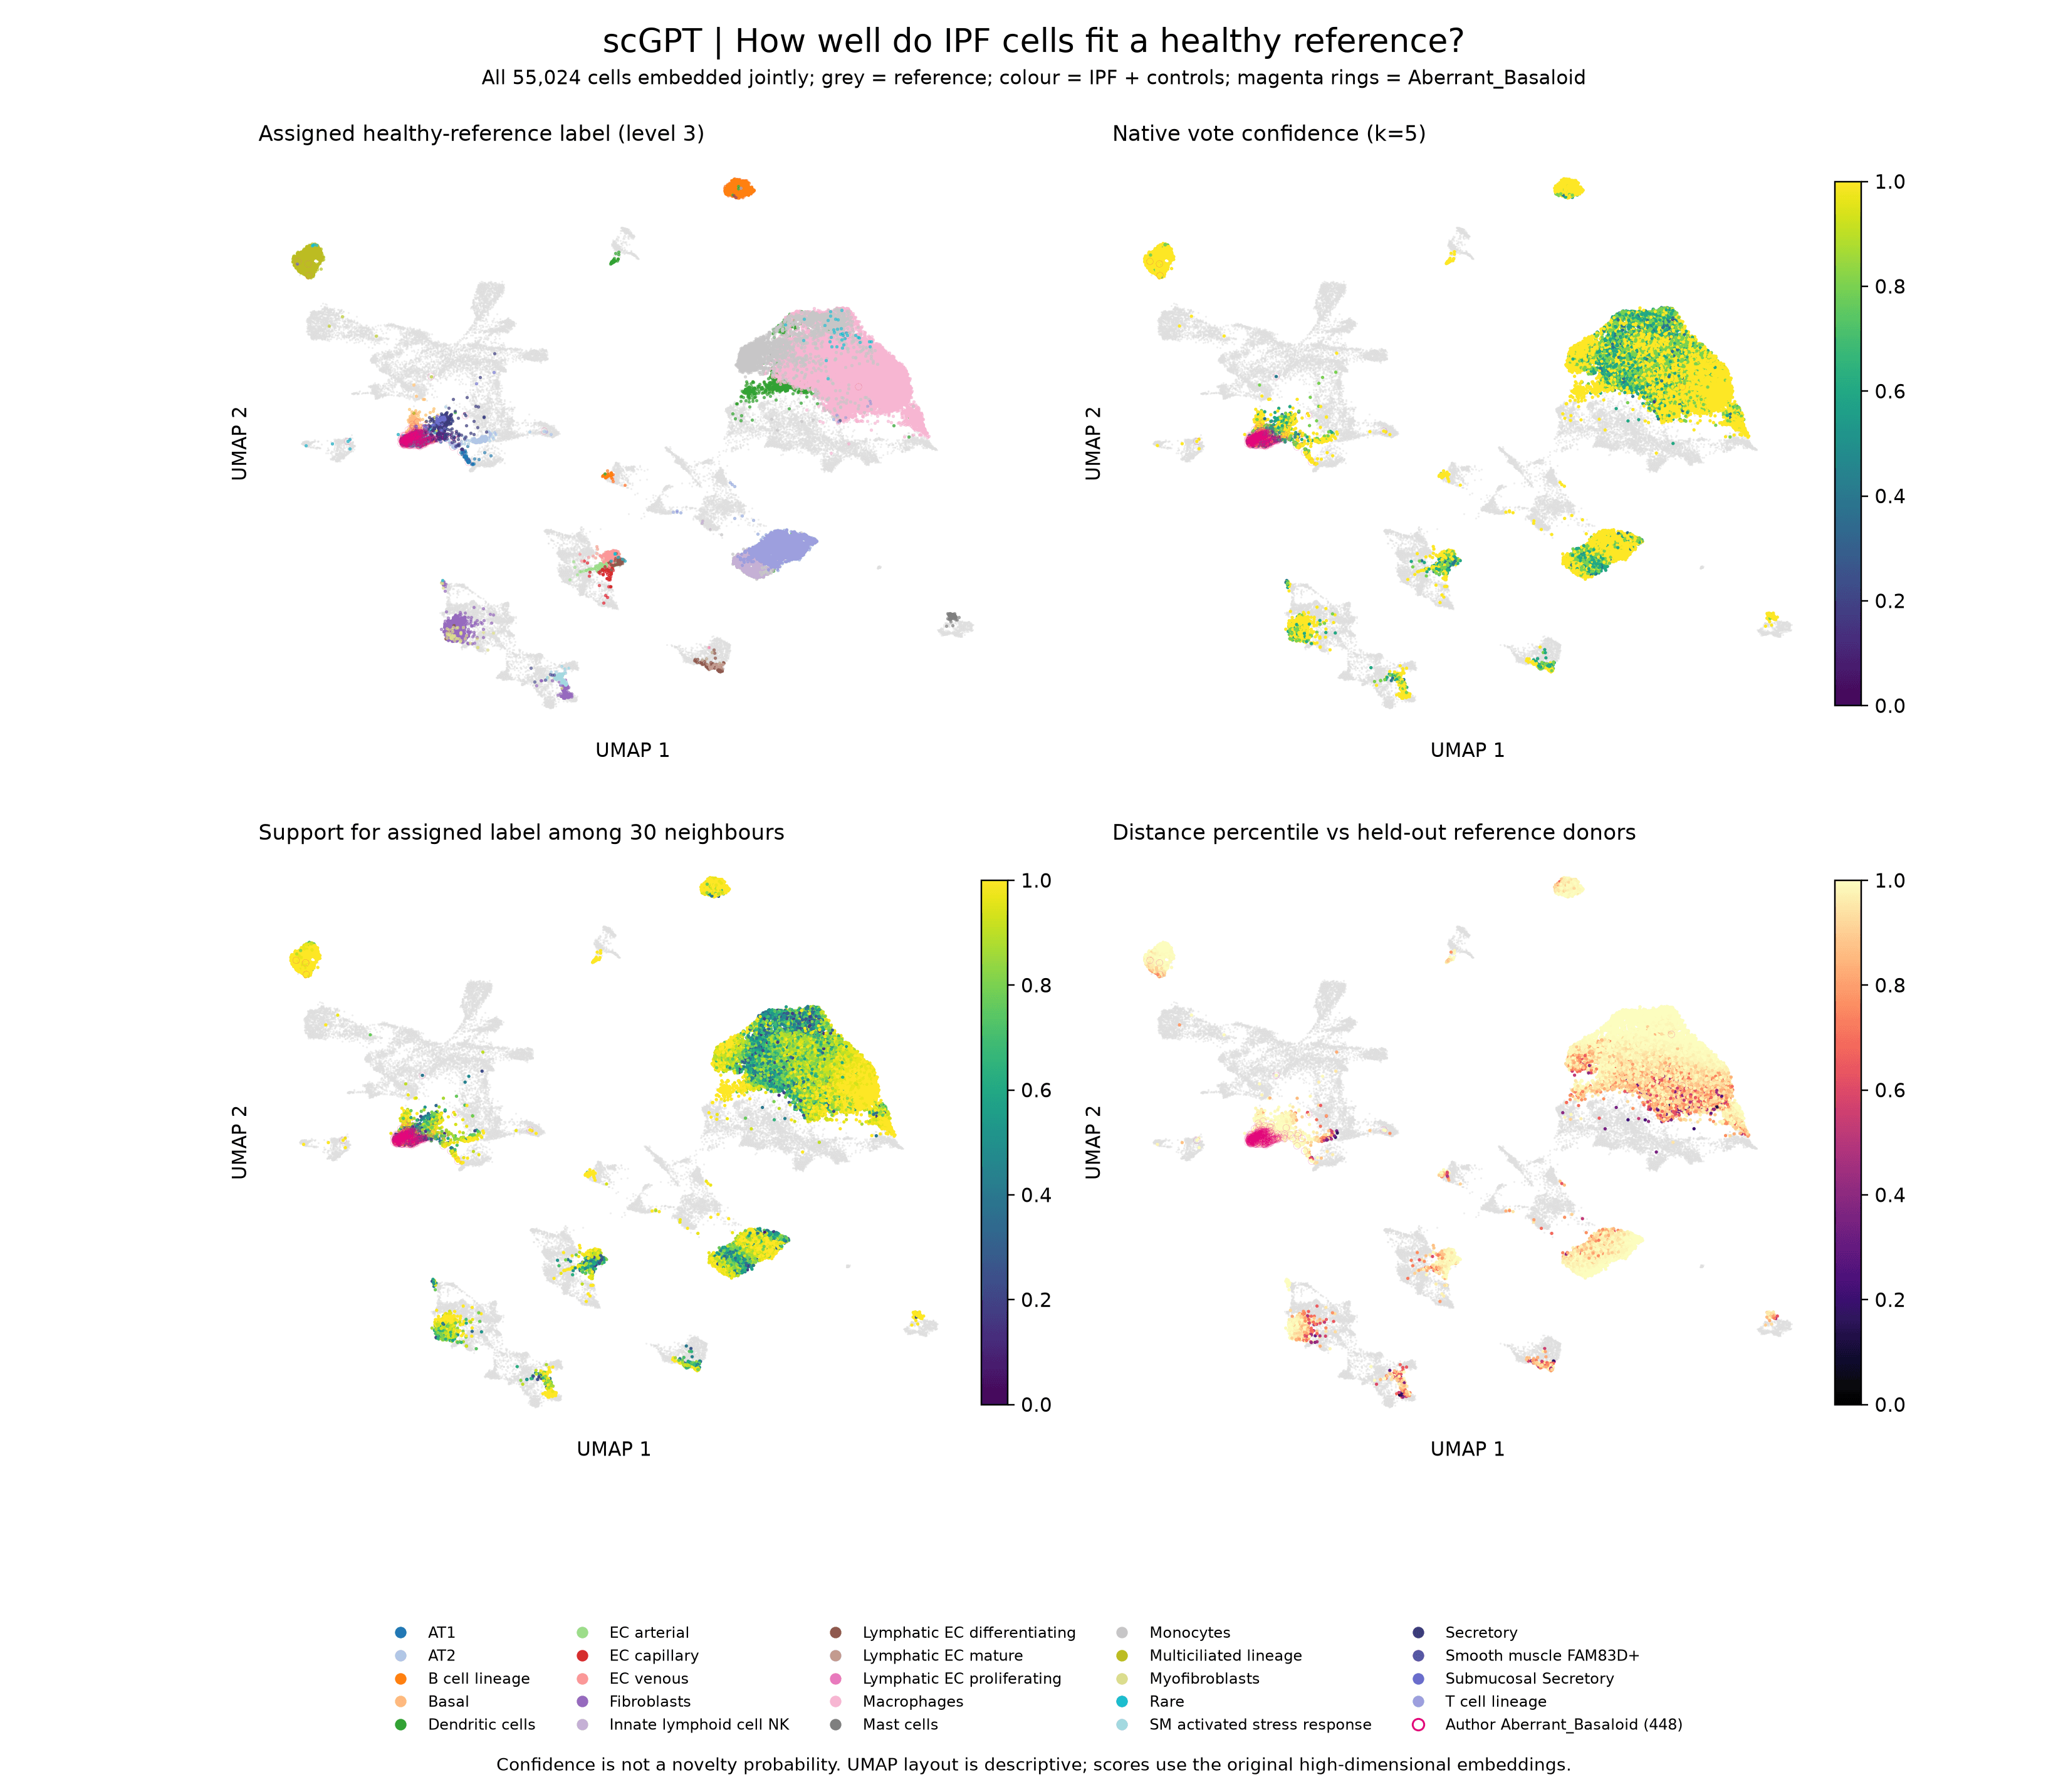
- In scGPT, most query cells (coloured) sit on top of the matching reference clusters (grey).
- In Geneformer-104M, the reference and the query form separate islands, even for cell types both datasets share. The distance panel (bottom right) is near the maximum for almost every query cell, healthy controls included.
- In both models, the aberrant basaloid cells (magenta) form their own group at the edge of the epithelial cells.
8Remove the batch effect from Geneformer and map again
- The healthy controls come from the same study as the IPF cells. Any gap between them and the reference is likely to be a batch effect, so you can measure it on the controls and subtract it.
Example prompt:
Geneformer puts all query cells, even healthy controls, far from the reference, so part of this is a batch effect between studies. Use the healthy control donors from the IPF study to estimate that shift, matching cell type composition, and remove it from all query cells. Check that the controls now sit close to the reference.

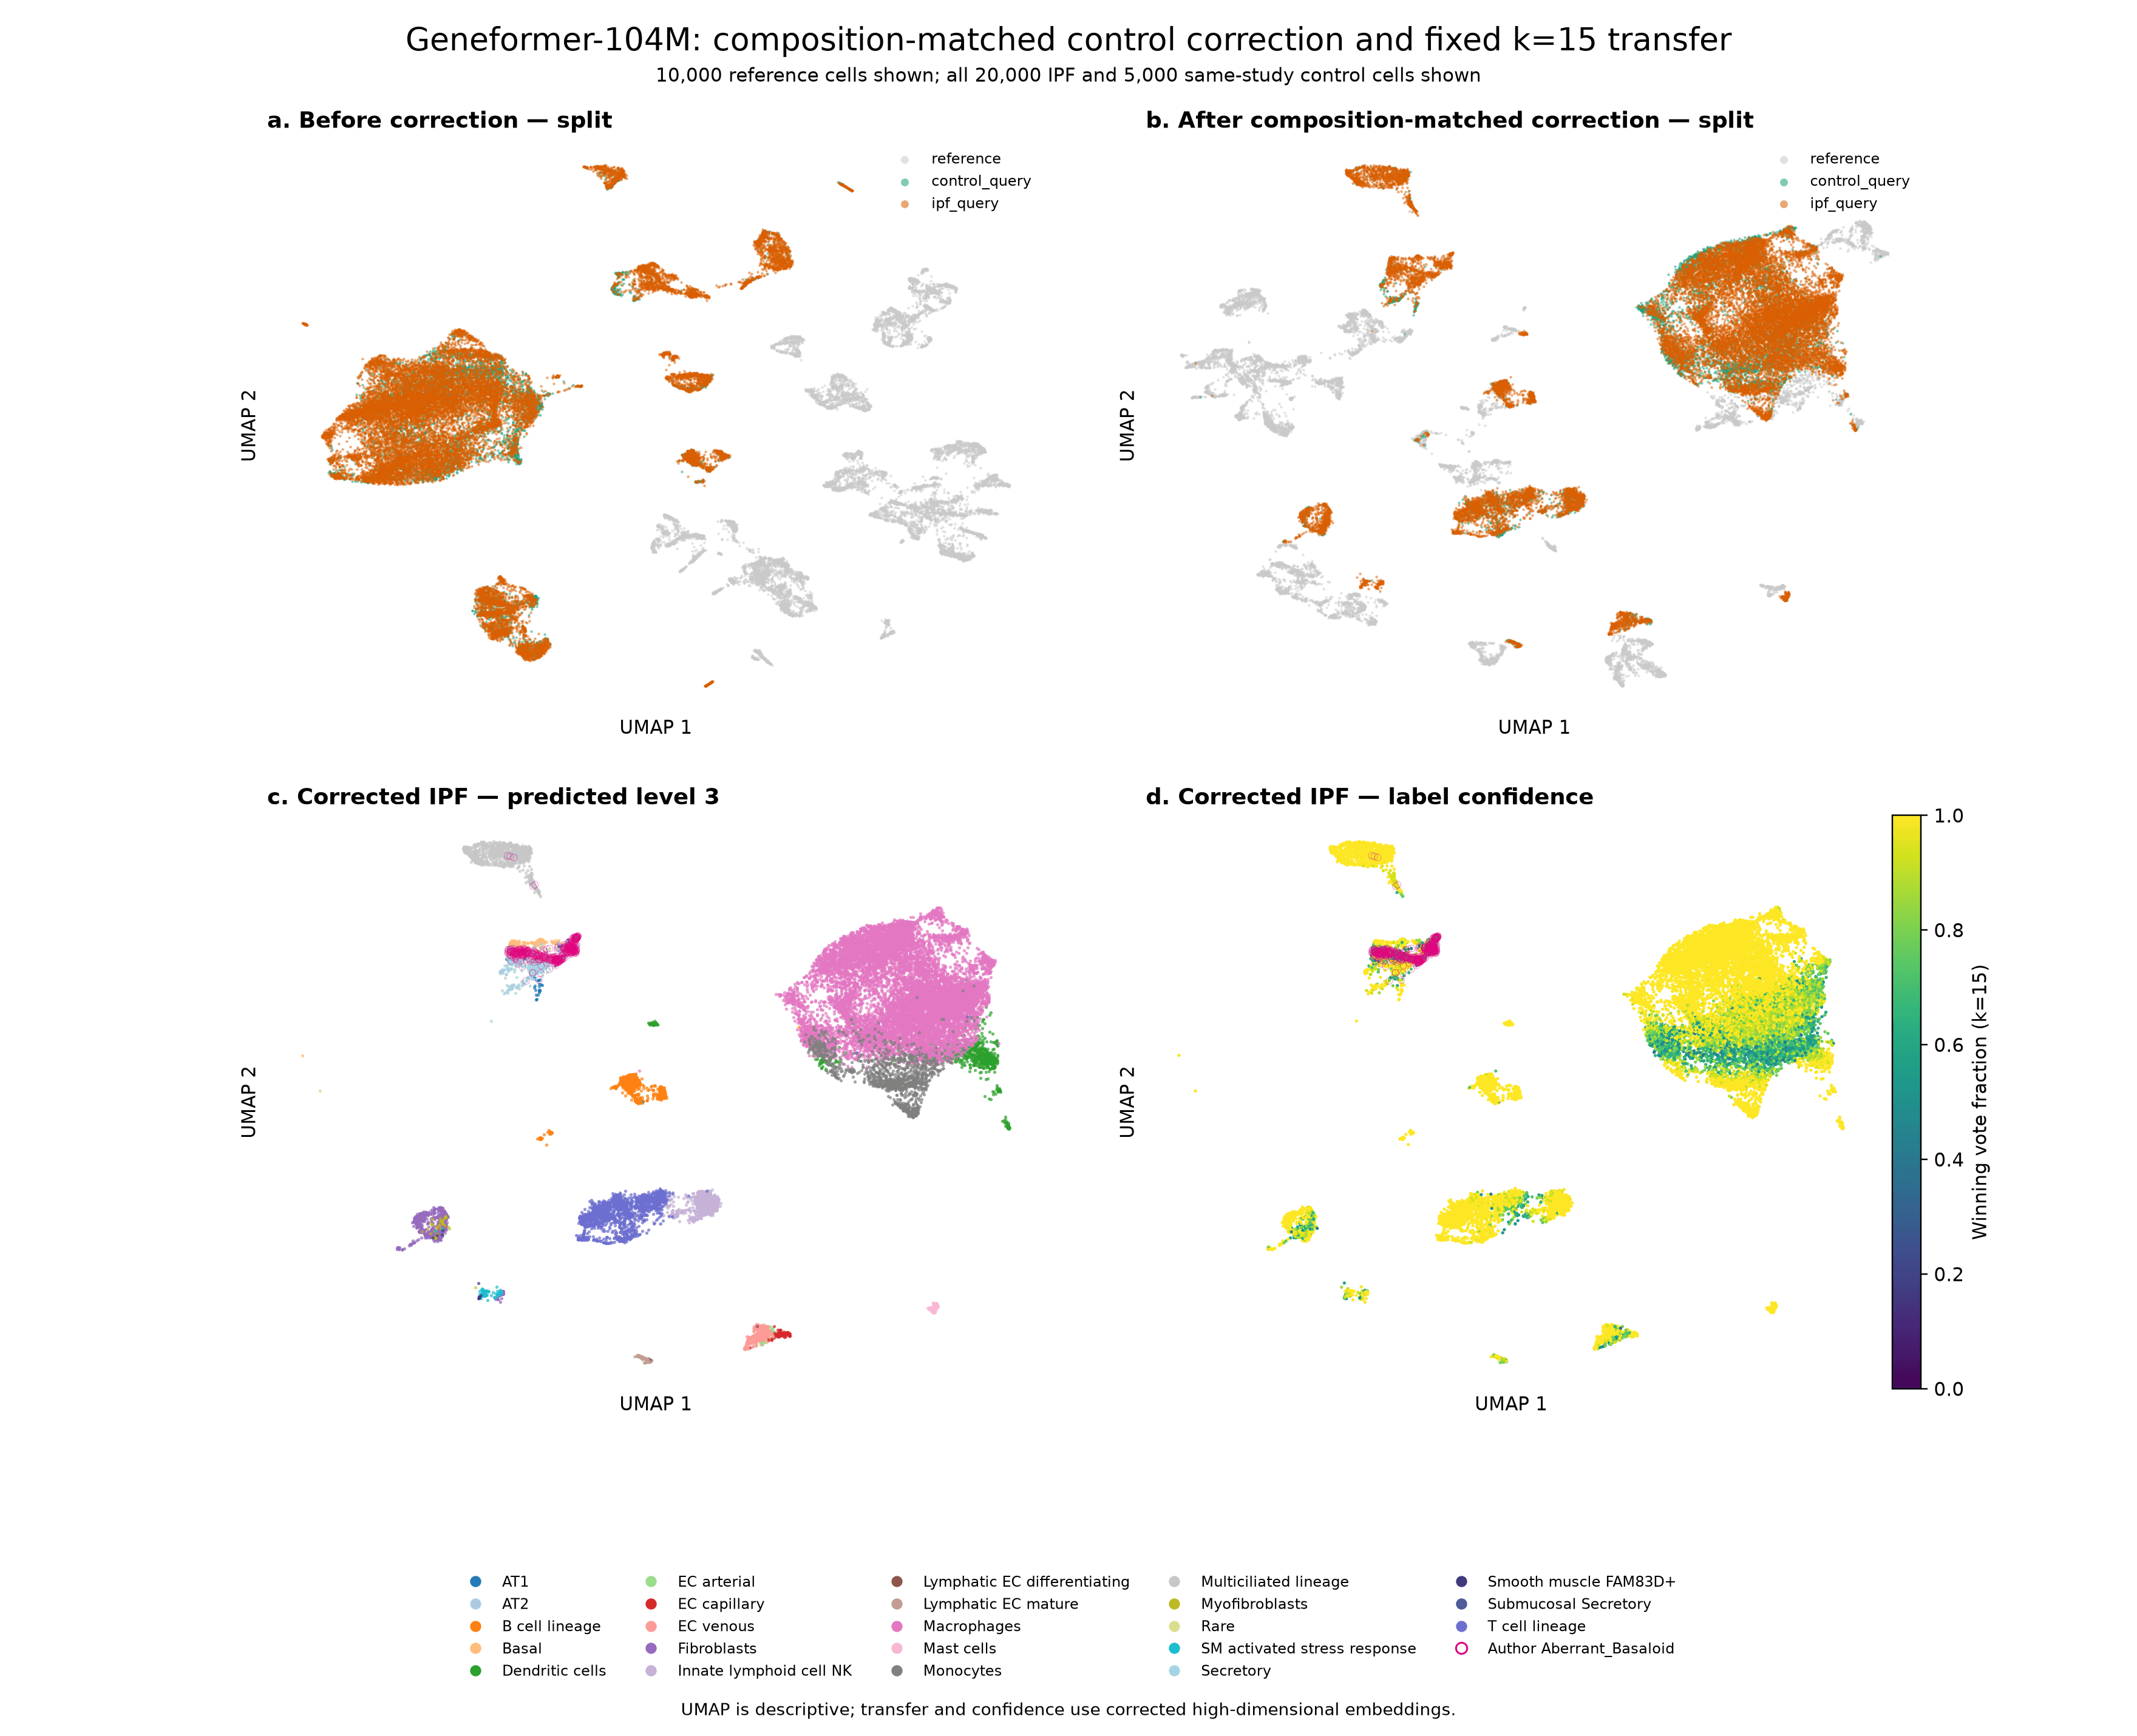
Then redo the mapping for scGPT and Geneformer-104M with a fixed k large enough for confidence to mean something, like 15. Show the scores against the authors' labels next to HLCA, the confidence for Aberrant_Basaloid vs AT2 cells, and the UMAPs.
- Compare panels a and b. Before the correction, the query sits apart from the reference. After it, the largest query clusters overlap the reference.
- The correction halved Geneformer-104M's distance from the controls to the reference (median 0.45 to 0.23). The agent checked this on control donors left out of the estimate. The correction reduces the shift rather than removing it, so some query clusters still sit apart. scGPT had a smaller study shift to begin with and changed little.
| Level | scGPT | Geneformer-104M | HLCA transfer |
|---|---|---|---|
| Level 3 | 0.777 (0.757–0.791) | 0.829 (0.803–0.846) | 0.780 (0.754–0.796) |
| Level 4 | 0.667 (0.636–0.693) | 0.822 (0.807–0.834) | 0.782 (0.758–0.803) |
- After the correction, Geneformer-104M gives the best labels at both levels, ahead of HLCA's purpose-built transfer.
To see where the remaining disagreements are, we ask for a confusion matrix.
Example prompt:
Can we add a confusion matrix of the level 4 labels for Geneformer-104M and HLCA's transfer, side by side, using the predictions from the label check. Rows are the authors' labels and columns are the predicted labels, normalised so each row sums to 1, with the number of cells per row on the axis. Only include the scored cell types, keep the same order for rows and columns, and put Transitional Club-AT2 and Interstitial macrophages next to the types they are confused with. Save as PNG.
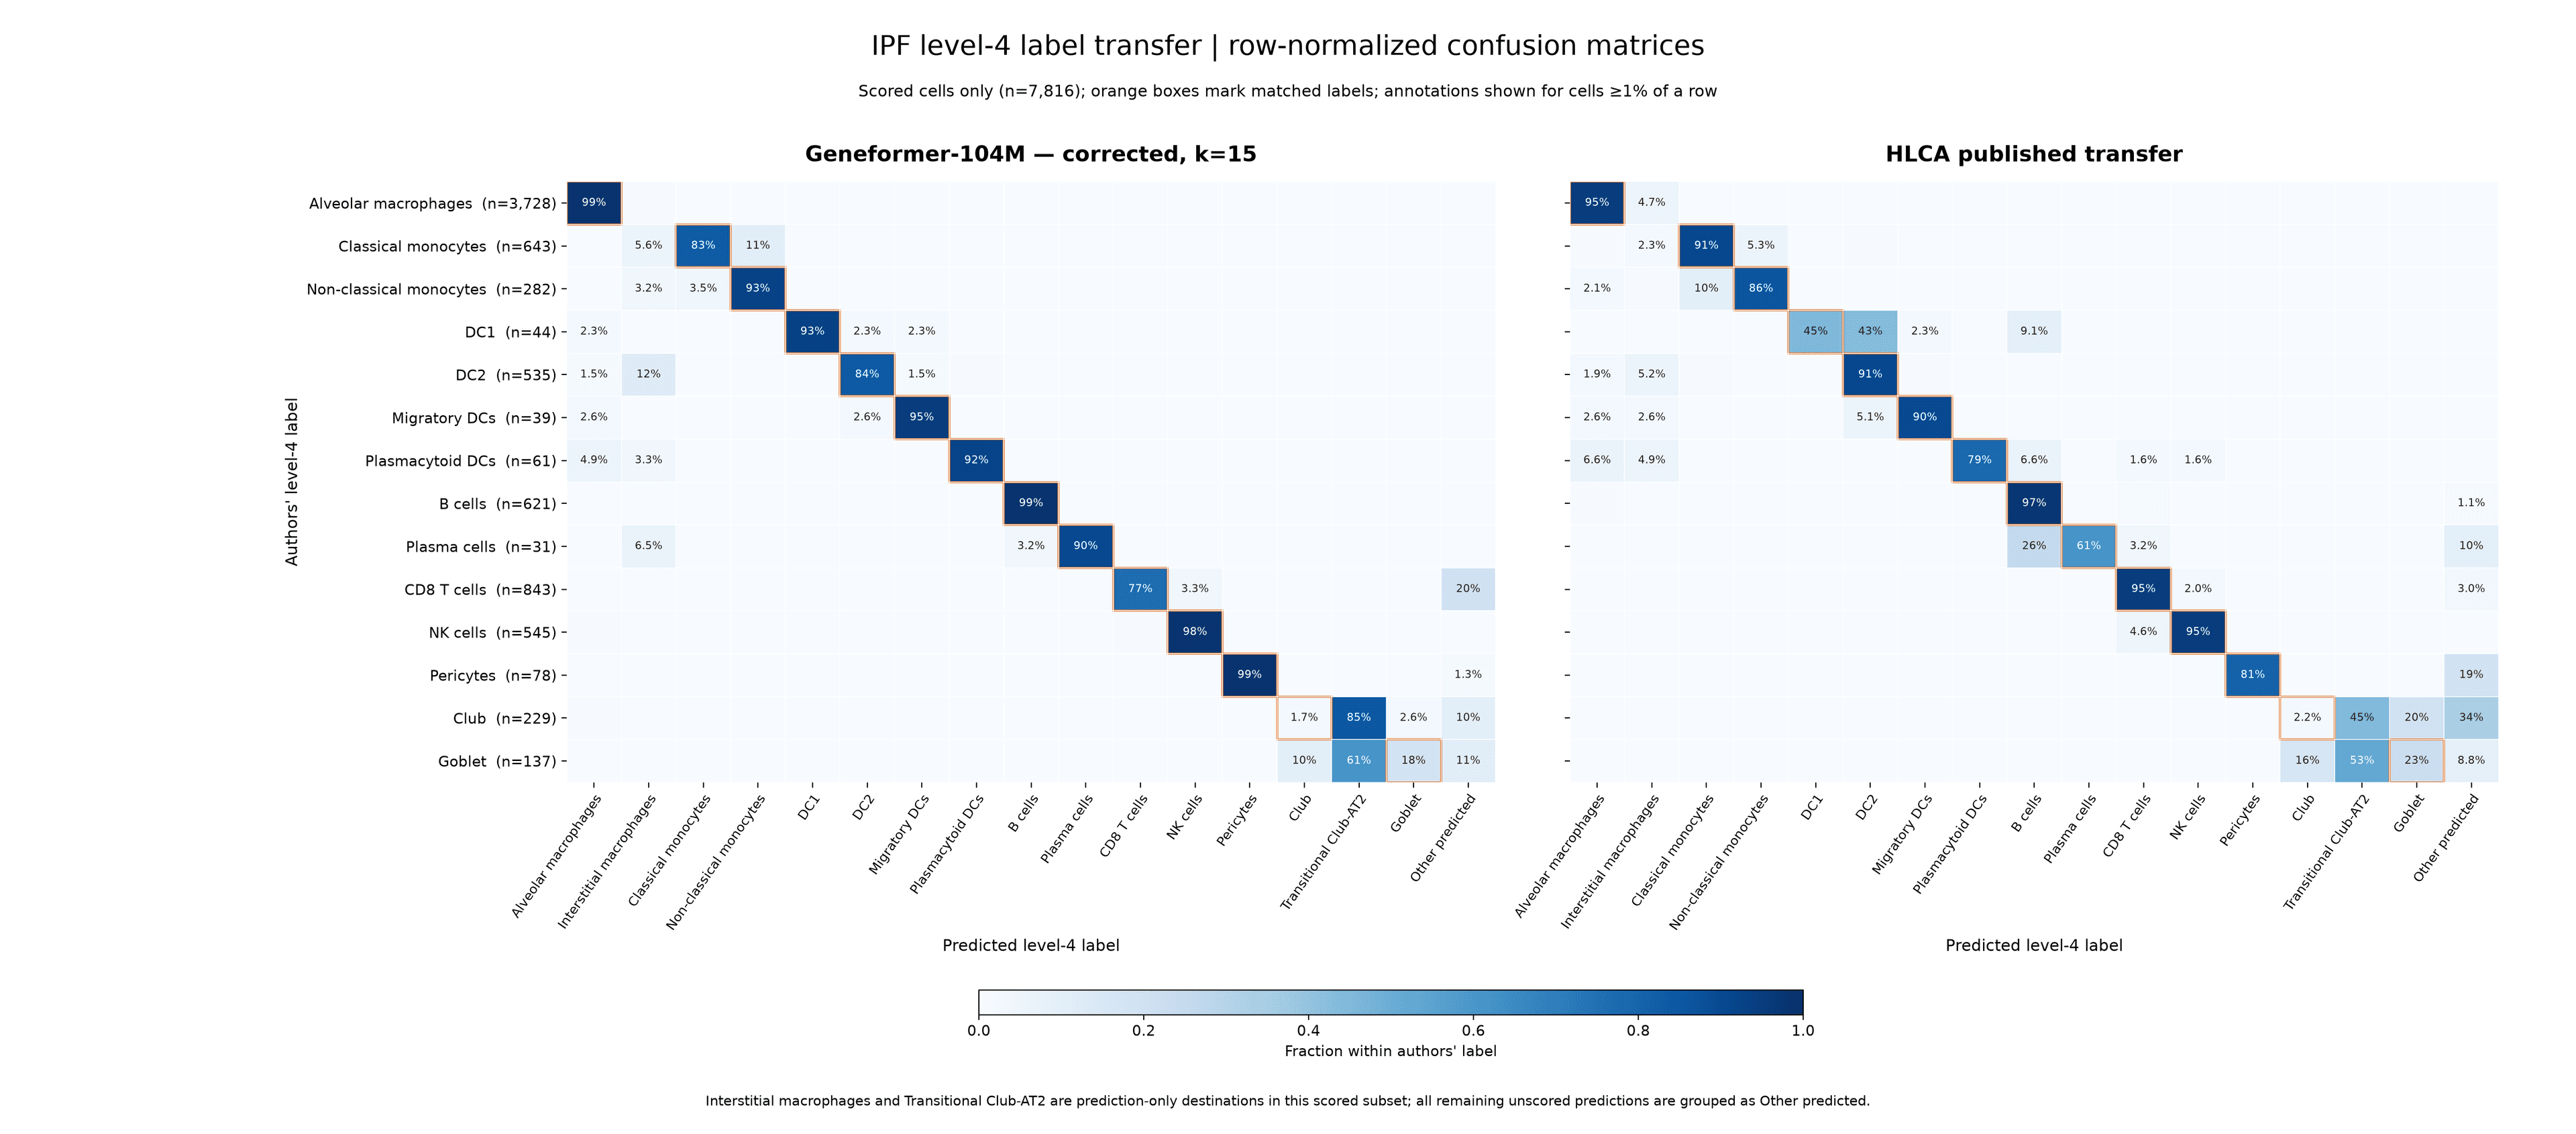
- Geneformer-104M gets 83% or more of the cells right for 11 of the 14 types, including the rare ones (DC1 93%, Migratory DCs 95%, Plasma cells 90%). HLCA's transfer splits DC1 cells almost evenly between DC1 and DC2 (45% and 43%), and calls 26% of Plasma cells B cells.
- The biggest disagreement for both methods is the secretory naming boundary from step 5: Geneformer-104M calls 85% of the authors' Club cells Transitional Club-AT2, and HLCA's transfer 45%.
- The one clear Geneformer-104M weakness is CD8 T cells, with 20% given a label outside the scored types. Given step 6, these are probably mostly CD4 T cell calls.
- Aberrant basaloid cells still get low confidence (0.63, against 0.91 for IPF AT2 and 0.96 for control AT2). Their mismatch is real biology, not the batch effect.
- The correction uses labelled healthy controls from the same study as the IPF cells. HLCA's transfer didn't get that help.
- This correction is deliberately simple: it subtracts one average shift from every query cell, which is why some clusters still sit apart. Dedicated methods such as Harmony or scArches (which HLCA itself uses for reference mapping) can correct shifts that differ between cell types, and don't need labelled controls. If you use one, check that cells with no healthy counterpart, like the aberrant basaloid cells, stay distinct rather than being pulled onto the reference.
Takeaways
- Through the Helical MCP, label transfer takes a handful of plain-language prompts, from public atlas to checked labels, with no GPU or model setup and for under a credit.
- Geneformer-104M, with no training on lung data, matches HLCA's purpose-built transfer, and beats it once the study shift is removed with same-study healthy controls. scGPT was weaker at the finer level throughout.
- Low confidence flags the cells a healthy reference can't explain. Here that's the aberrant basaloid cells, while AT2 cells stay confident in both IPF and controls.
- Check the disagreements before you trust a score. Some were naming differences between atlases (Club vs Transitional Club-AT2), some were disease states (SPP1-high macrophages) and some were real errors (CD8 vs CD4 T cells).
- Check the data before you embed it: which genes have symbols, which labels are filled in, and whether the query sits apart from the reference for technical reasons.
- This is one of many computational experiments you can run in Helical, the virtual AI lab for biology.
References
- Sikkema L, et al. An integrated cell atlas of the lung in health and disease. Nature Medicine 2023;29:1563–1577. 10.1038/s41591-023-02327-2
- Adams TS, et al. Single-cell RNA-seq reveals ectopic and aberrant lung-resident cell populations in idiopathic pulmonary fibrosis. Science Advances 2020;6:eaba1983. 10.1126/sciadv.aba1983
- Morse C, et al. Proliferating SPP1/MERTK-expressing macrophages in idiopathic pulmonary fibrosis. European Respiratory Journal 2019;54:1802441. 10.1183/13993003.02441-2018
- Korsunsky I, et al. Fast, sensitive and accurate integration of single-cell data with Harmony. Nature Methods 2019;16:1289–1296. 10.1038/s41592-019-0619-0
- Lotfollahi M, et al. Mapping single-cell data to reference atlases by transfer learning. Nature Biotechnology 2022;40:121–130. 10.1038/s41587-021-01001-7
- Patel AA, et al. The fate and lifespan of human monocyte subsets in steady state and systemic inflammation. Journal of Experimental Medicine 2017;214:1913–1923. PMC5502436